TdxChartXYSeriesFullStackedAreaView Class
Stores Full-Stacked Area View settings.
Declaration
TdxChartXYSeriesFullStackedAreaView = class(
    TdxChartXYSeriesAreaView
)
Remarks
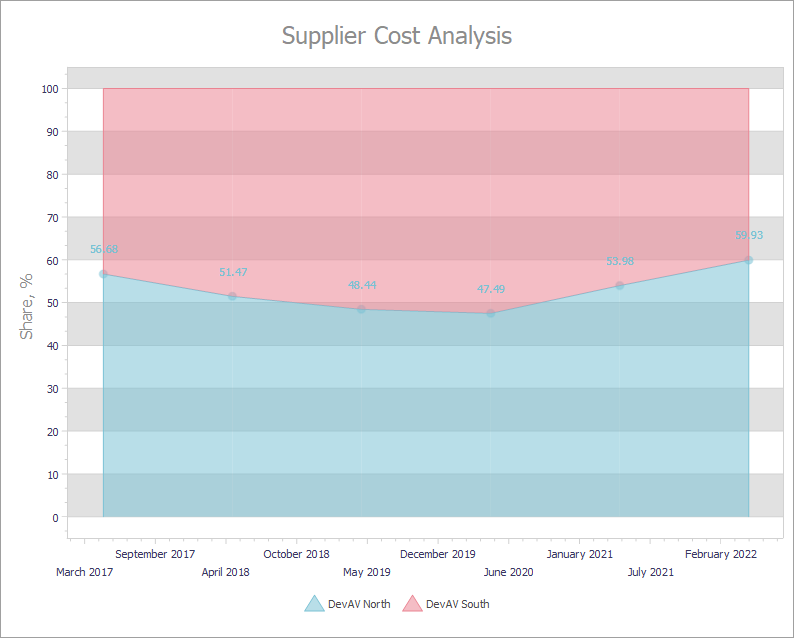
An Area View displays series values as filled areas on a diagram. Heights of peaks and hollows of filled areas reflect series point values. All Area Views support the same line appearance settings for filled area borders as Line Views.
The TdxChartXYSeriesFullStackedAreaView class implements the Full-Stacked Area View designed to display series as stacked areas on a diagram. Unlike the Stacked Area View, stacked areas always occupy an entire diagram area by height, and the axis of values displays percentage values. Use this View when you display multiple series and you need to emphasize percentage contribution of each series. To select the Full-Stacked Area View, assign 'FullStackedArea' to the ViewType property of an XY series.
Main API Members
The list below outlines key members of the TdxChartXYSeriesFullStackedAreaView class that allow you to customize appearance of an XY series that uses the Full-Stacked Area View.
- Customize line and area appearance (Appearance).
- Display value markers and change their size, shape, and color (Markers).
- Switch between levels of line draw performance optimization (Optimization).
- Obtain the series View description (GetDescription).
- Display and customize value labels (ValueLabels).
- Access the series to which the current Area View settings belong (Series).
Direct TdxChartXYSeriesFullStackedAreaView Class References
The View property of an XY series references the TdxChartXYSeriesFullStackedAreaView class as a TdxChartSeriesCustomView object if the ViewType property of the series is set to 'FullStackedArea'. You need to cast the returned object to the TdxChartXYSeriesFullStackedAreaView class to access all public members.