TdxChartCustomSeries Class
The base class for all chart series classes.
Declaration
TdxChartCustomSeries = class(
    TcxLockableComponent,
    IdxChartLegendItem,
    IdxChartCloneComponent
)
Remarks
A series is a set of data points displayed in a diagram. The TdxChartCustomSeries class implements appearance and behavior settings common to all series classes. Common settings include data binding modes and a data point collection.
Main API Members
The list below outlines key members of the TdxChartCustomSeries class that allow you to configure series.
- Specify series caption and title (Caption and Title).
- Switch between data access modes (DataBindingClass and DataBindingType).
- Configure the connection between the series and its data source (DataBinding).
- Move the series between diagrams (Diagram).
- Determine how the Chart control displays empty data points in the series (EmptyPointsDisplayMode).
- Specify if users can click the corresponding legend item check box to hide or display the series (CheckableInLegend).
- Sort data points by values or arguments in ascending or descending order (SortBy and SortOrder).
- Change series Z-order or position (Index).
- Access and manage series points (Points).
- Specify the custom name for saving series points to a stream (StoredName).
- Copy settings between series (AssignFrom).
- Avoid excessive redraw operations during batch data and appearance changes (BeginUpdate, CancelUpdate, and EndUpdate).
- Switch between available View types (ViewClass and ViewType).
- Customize appearance settings for the selected series View (View).
- Display the top N points in the series (TopNOptions).
Available Series Types
A diagram’s Series and VisibleSeries properties reference created series as TdxChartCustomSeries objects. Cast them to the following descendant classes to access all series type-specific properties and methods:
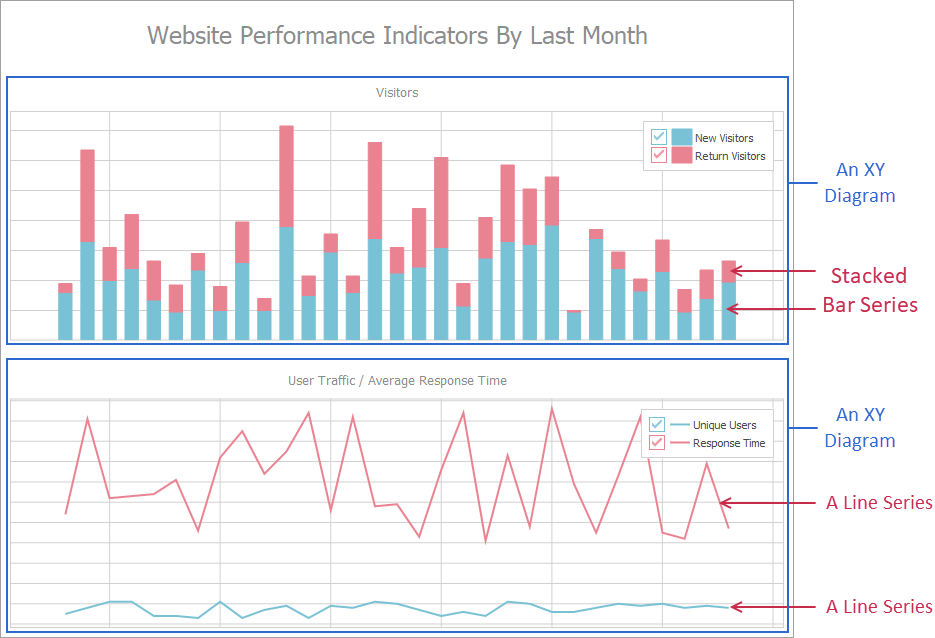
- TdxChartXYSeries
A series compatible with XY diagrams designed to display data using the axis of arguments and the axis of values. An XY series supports Area, Bar, and Line Views.
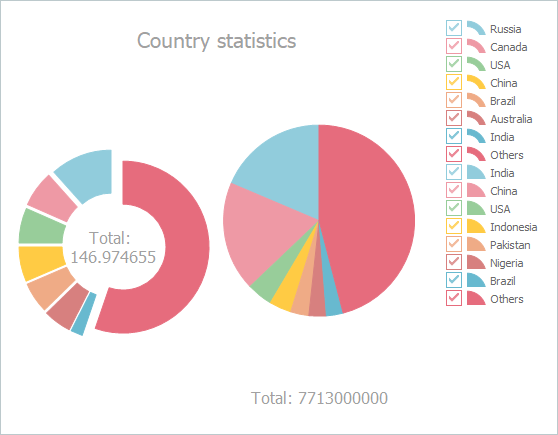
- TdxChartSimpleSeries
A series compatible with simple diagrams with support for Pie and Doughnut Views.
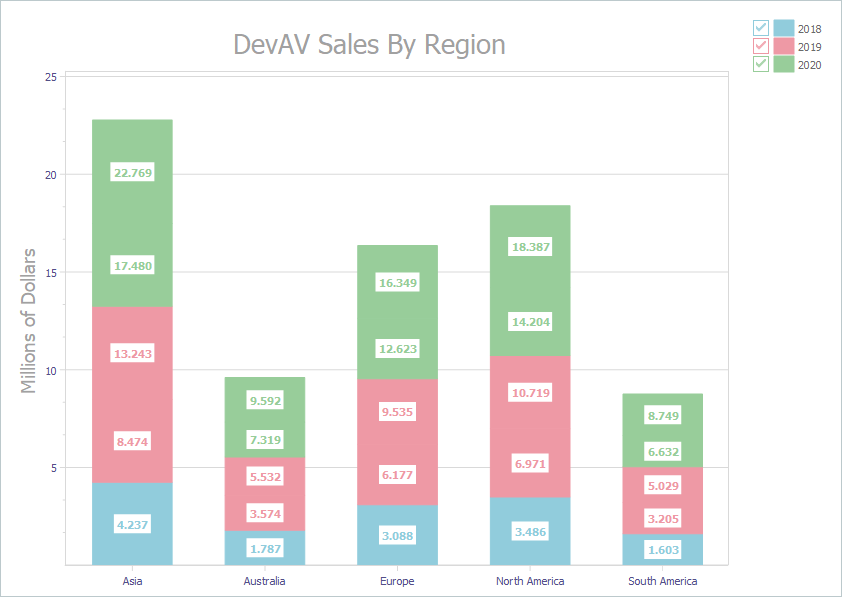
Example
The following code example creates three stacked bar series with identical appearance settings in unbound data access mode:
var
  AXYDiagram: TdxChartXYDiagram;
  AXY2018Series, AXY2019Series, AXY2020Series: TdxChartXYSeries;
  AStackedBarView: TdxChartXYSeriesStackedBarView;
begin
  dxChartControl1.BeginUpdate;  // Initiates the following batch change
  try
    AXYDiagram := dxChartControl1.AddDiagram<TdxChartXYDiagram>('DevAV Sales By Region');
    AXYDiagram.Title.Appearance.FontOptions.Size := 20;
    AXYDiagram.Axes.AxisY.Title.Text := 'Millions of Dollars';
    AXYDiagram.Axes.AxisY.Title.Appearance.FontOptions.Size := 14;
    AXY2018Series := AXYDiagram.AddSeries('2018');  // Creates a new series with the caption "2018"
    AXY2018Series.DataBindingType := 'Unbound';  // Selects the unbound data access mode
    // Changes the argument field type to "string"
    TdxChartXYSeriesUnboundDataBinding(AXY2018Series.DataBinding).ArgumentField.ValueType := 'string';
    AXY2018Series.ViewType := 'StackedBar';  // Selects the Stacked Bar series View
    AStackedBarView := AXY2018Series.View as TdxChartXYSeriesStackedBarView;
    AStackedBarView.ValueLabels.Visible := True;  // Displays value labels on bars
    AStackedBarView.ValueLabels.NumberFormat := '0.000';  // Changes the number display format
    AStackedBarView.ValueLabels.Appearance.FontOptions.Bold := True;
    AXY2018Series.Points.Add('Asia', 4.2372);
    AXY2018Series.Points.Add('Australia', 1.7871);
    AXY2018Series.Points.Add('Europe', 3.0884);
    AXY2018Series.Points.Add('North America', 3.4855);
    AXY2018Series.Points.Add('South America', 1.6027);
    AXY2019Series := AXYDiagram.AddSeries;  // Creates a new series with the default settings
    AXY2019Series.AssignFrom(AXY2018Series);  // Copies all settings from the "2018" series
    AXY2019Series.Caption := '2019';  // Defines a different series caption
    AXY2019Series.Points.Add('Asia', 4.7685);
    AXY2019Series.Points.Add('Australia', 1.9576);
    AXY2019Series.Points.Add('Europe', 3.3579);
    AXY2019Series.Points.Add('North America', 3.7477);
    AXY2019Series.Points.Add('South America', 1.8237);
    AXY2020Series := AXYDiagram.AddSeries('2020');  // Creates a new series with the default settings
    AXY2020Series.AssignFrom(AXY2018Series);  // Copies all settings from the "2018" series
    AXY2020Series.Caption := '2020';  // Defines a different series caption
    AXY2020Series.Points.Add('Asia', 5.289);
    AXY2020Series.Points.Add('Australia', 2.2727);
    AXY2020Series.Points.Add('Europe', 3.7257);
    AXY2020Series.Points.Add('North America', 4.1825);
    AXY2020Series.Points.Add('South America', 2.1172);
  finally
    dxChartControl1.EndUpdate;  // Calls EndUpdate regardless of the batch operation's success
  end;
end;
Series Deletion
To delete all series in a diagram, call its DeleteAllSeries procedure. To delete an individual series, release it directly in code (call the Free procedure in Delphi or use the delete keyword in C++Builder).