TdxChartControl Class
A Chart control.
Declaration
TdxChartControl = class(
    TdxCustomChartControl
)
Remarks
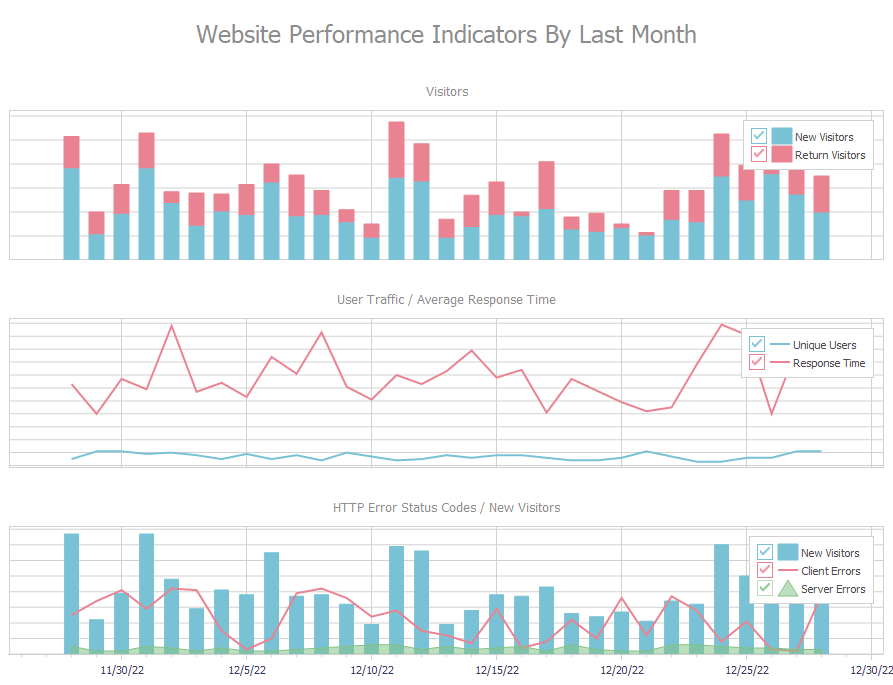
The Chart control can display one or more diagrams. Each diagram holds data series and visualizes those series with the help of different View types:
Available Diagram Types
- XY Diagram
Displays series on a two-dimensional surface with argument and value axes (X-axis and Y-axis). An XY diagram can plot Area, Bar, and Line series.
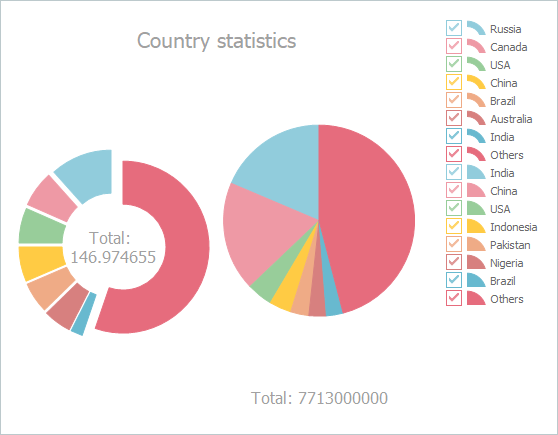
- Simple Diagram
Displays series as Pie or Doughnut charts.
Bind to Data
All supported series can work in the following data access modes:
- Bound
- A chart series connects to a dataset and loads all data records into memory.
- Unbound
- A chart series is not bound to a dataset. You need to populate series with data points manually.
Main API Members
The list below outlines key class members that allow you to manage diagrams and customize Chart control appearance settings.
- Enable or disable the Chart control’s skin-dependent border (BorderStyle).
- Configure the control’s legend pane (Legend).
- Manage Chart control titles (Titles).
- Create a new diagram (AddDiagram).
- Obtain the total number of diagrams and the number of currently visible diagrams in the Chart control (DiagramCount and VisibleDiagramCount).
- Obtain HitTest information for any point within the Chart control client area (CalculateHitTest).
- Identify the visual Chart element under the mouse pointer and respond to hot-tracking different visual elements (HitTest, OnHotTrackElement, and OnMouseMove).
- Access visible and hidden diagrams by their indexes (VisibleDiagrams and Diagrams).
- Customize Chart control appearance settings (Appearance).
- Switch between bidirectional modes (BiDiMode).
- Configure the control’s look & feel settings (LookAndFeel).
- Avoid excessive redraw operations during batch data and appearance changes (BeginUpdate, CancelUpdate, and EndUpdate).
- Respond to any setting or diagram change in the Chart control (OnChange).
- Customize zoom and scroll settings (ZoomOptions and ScrollOptions).
- Store series data in a memory stream (SaveToStream and LoadFromStream).
Example
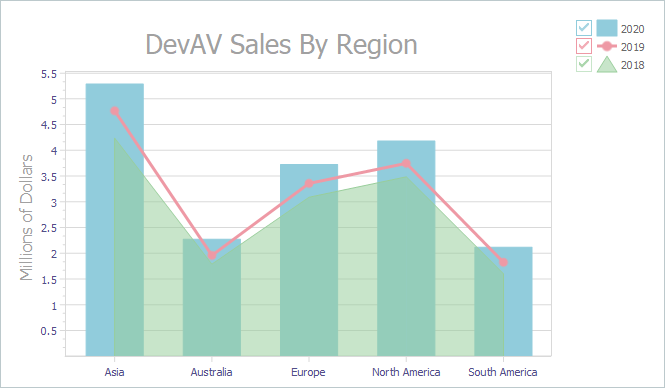
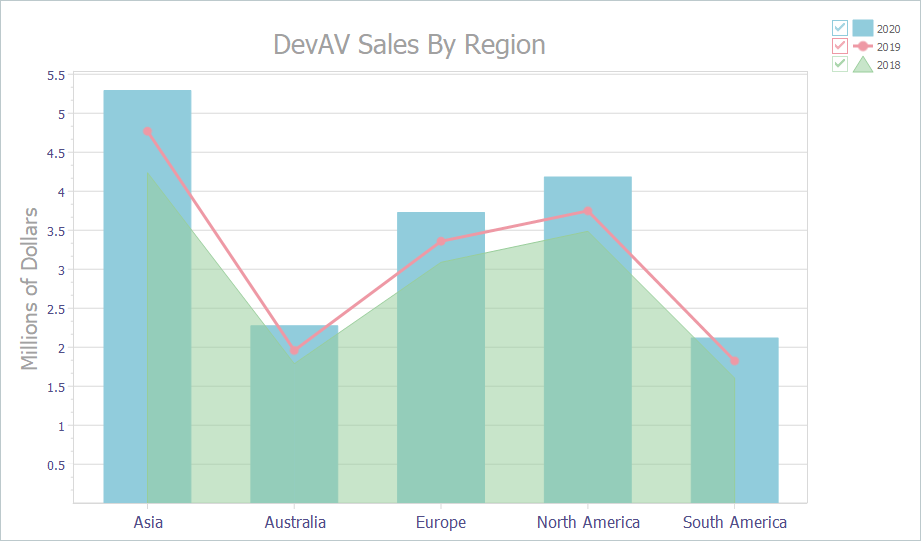
The following code example creates an XY diagram with three series that use Area, Bar, and Line View types:
var
  AXYDiagram: TdxChartXYDiagram;
  AXYSeries: TdxChartXYSeries;
begin
  dxChartControl1.BeginUpdate;  // Initiates the following batch change
  try
    AXYDiagram := dxChartControl1.AddDiagram<TdxChartXYDiagram>('DevAV Sales By Region');
    AXYDiagram.Title.Appearance.FontOptions.Size := 20;
    AXYDiagram.Axes.AxisY.Title.Text := 'Millions of Dollars';
    AXYDiagram.Axes.AxisY.Title.Appearance.FontOptions.Size := 16;
    AXYDiagram.Axes.AxisY.ValueLabels.Appearance.FontOptions.Size := 10;
    AXYDiagram.Axes.AxisX.ValueLabels.Appearance.FontOptions.Size := 12;
    AXYSeries := AXYDiagram.AddSeries('2018');
    AXYSeries.DataBindingType := 'Unbound';  // Selects the unbound data access mode
    TdxChartXYSeriesUnboundDataBinding(AXYSeries.DataBinding).ArgumentField.ValueType := 'string';
    AXYSeries.ViewType := 'Area';  // Selects the Area series View
    AXYSeries.Points.Add('Asia', 4.2372);
    AXYSeries.Points.Add('Australia', 1.7871);
    AXYSeries.Points.Add('Europe', 3.0884);
    AXYSeries.Points.Add('North America', 3.4855);
    AXYSeries.Points.Add('South America', 1.6027);
    AXYSeries := AXYDiagram.AddSeries('2019');
    AXYSeries.DataBindingType := 'Unbound';  // Selects the unbound data access mode
    TdxChartXYSeriesUnboundDataBinding(AXYSeries.DataBinding).ArgumentField.ValueType := 'string';
    AXYSeries.ViewType := 'Line';  // Selects the Line series View
    AXYSeries.Points.Add('Asia', 4.7685);
    AXYSeries.Points.Add('Australia', 1.9576);
    AXYSeries.Points.Add('Europe', 3.3579);
    AXYSeries.Points.Add('North America', 3.7477);
    AXYSeries.Points.Add('South America', 1.8237);
    TdxChartXYSeriesLineView(AXYSeries.View).Appearance.StrokeOptions.Width := 3;
    TdxChartXYSeriesLineView(AXYSeries.View).Markers.Kind := TdxChartXYMarkerKind.Circle;
    TdxChartXYSeriesLineView(AXYSeries.View).Markers.Visible := True;
    AXYSeries := AXYDiagram.AddSeries('2020');
    AXYSeries.DataBindingType := 'Unbound';  // Selects the unbound data access mode
    TdxChartXYSeriesUnboundDataBinding(AXYSeries.DataBinding).ArgumentField.ValueType := 'string';
    AXYSeries.ViewType := 'Bar';  // Selects the Bar series View
    AXYSeries.Points.Add('Asia', 5.289);
    AXYSeries.Points.Add('Australia', 2.2727);
    AXYSeries.Points.Add('Europe', 3.7257);
    AXYSeries.Points.Add('North America', 4.1825);
    AXYSeries.Points.Add('South America', 2.1172);
    AXYSeries.Index := 0; // Moves the created bar series to the innermost layer
  finally
    dxChartControl1.EndUpdate;  // Calls EndUpdate regardless of the batch operation's success
  end;
end;
Inheritance
See Also