VCL Charts: Line View Tutorial
- 2 minutes to read
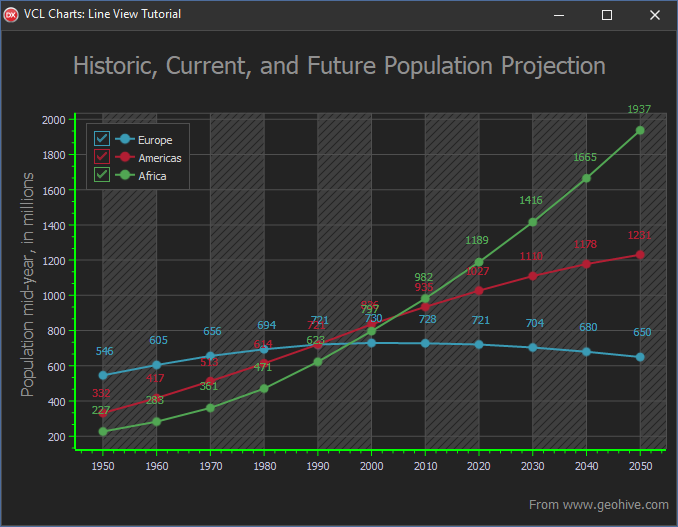
This tutorial describes how to add a VCL Chart control to the application, create line series, bind them to data, and customize diagram appearance.
Before You Begin
This tutorial uses a data file that ships with our demos. The default installation path for data files is: C:\Users\Public\Documents\DevExpress\VCL\Demos\ExpressCharts\Data\
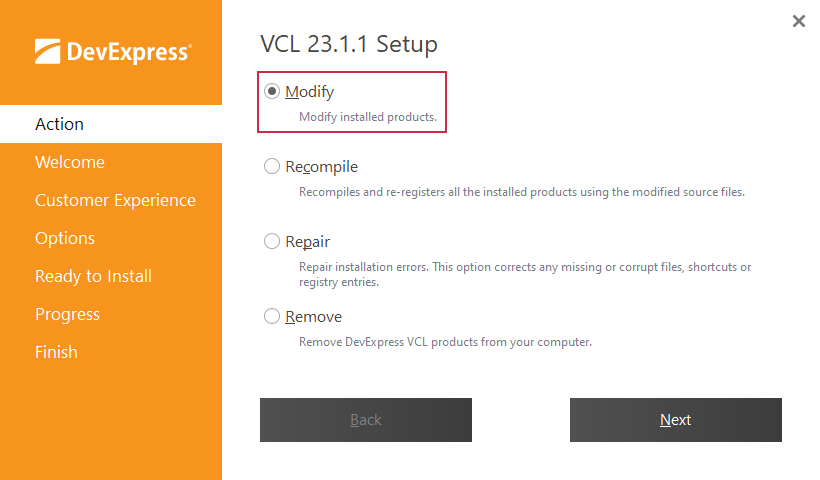
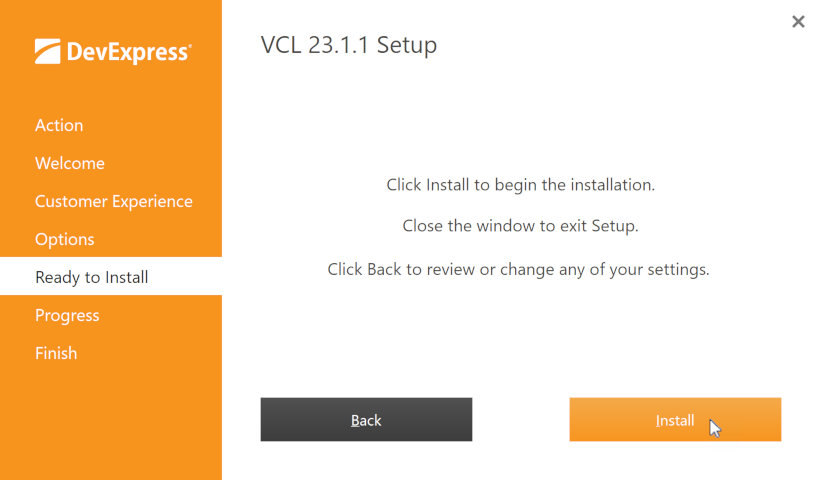
If you did not install our demos, run the DevExpress VCL component installer and follow the steps below.
Select the Modify option in the Action tab.
Navigate through installer steps to Options and check the Install demos option.
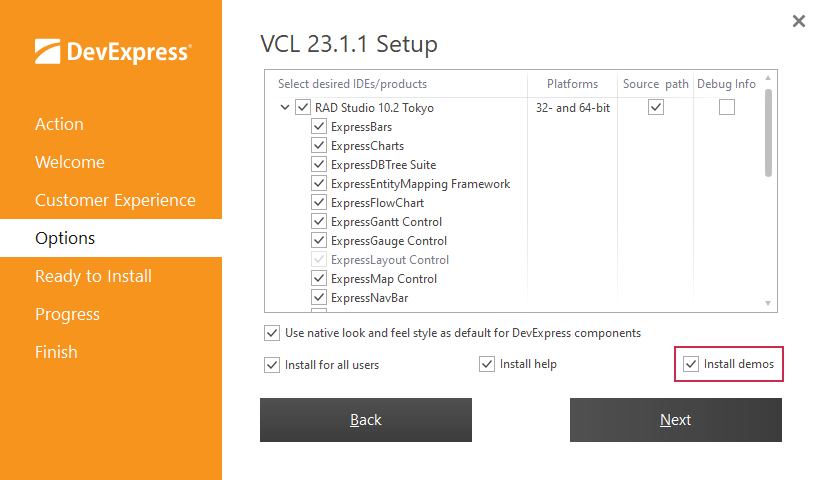
Go to the Ready to install tab and click Install to add missing product demos.
Tutorial Steps
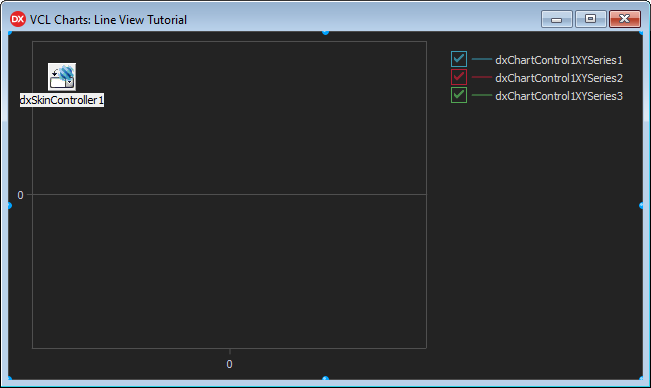
- Step 1: Create Line Series
This step describes how to add a VCL Chart control, create XY line series, and apply a skin to the project at design time.
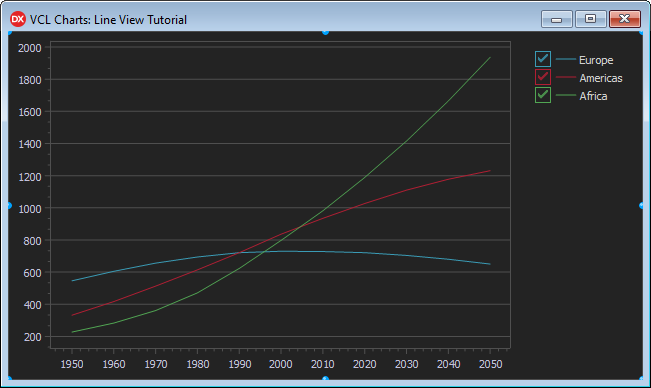
- Step 2: Bind Series to Data
This step demonstrates how to populate a memory-based dataset, configure a data source, and bind XY line series to dataset fields.
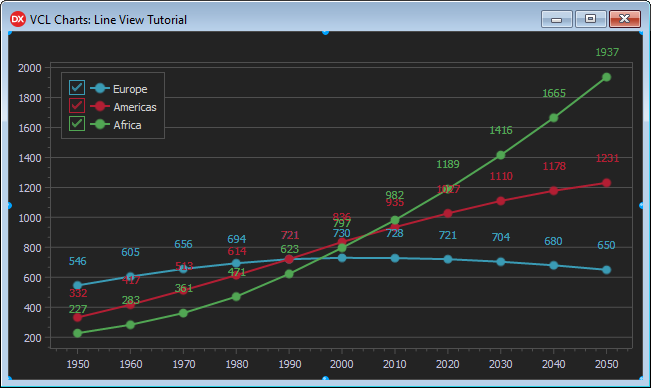
- Step 3: Series Appearance Customization
This step details how to display value markers and labels, customize line appearance, and change legend pane position.
- Step 4: Chart Appearance Customization
This step describes how to add optional visual chart elements and customize general chart appearance settings to enhance diagram readability.