TdxChartCustomAxis Class
The base class for axis classes in the Chart control.
Declaration
TdxChartCustomAxis = class(
    TdxChartCustomVisualElement
)
Remarks
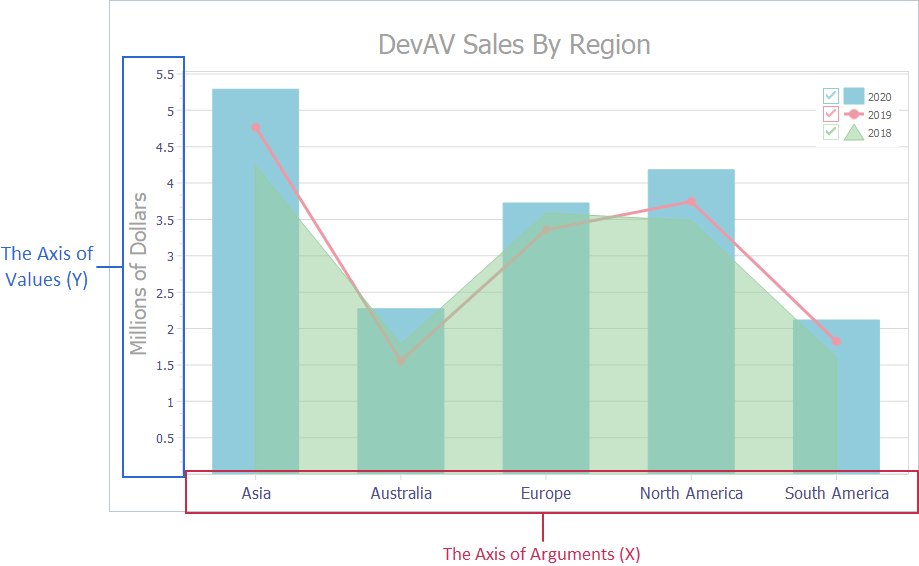
The axis of arguments (X-axis) and the axis of values (Y-axis) form a two-dimensional Cartesian coordinate system in an XY diagram. The TdxChartCustomAxis class implements common functionality for axes.
Main API Members
The list below outlines key members of the TdxChartCustomAxis class that allow you to configure an axis.
- Hide or display the axis (Visible).
- Specify a title for the axis and change the title’s appearance and position (Title).
- Adjust the numeric value range of the axis (Range and NumericScaleOptions).
- Customize appearance of major and minor axis tick marks (Ticks).
- Change the number of minor tick marks (MinorCount).
- Display axis value labels and customize their appearance (ValueLabels).
- Position the axis in a diagram (Alignment).
- Reverse the axis scale direction (Reverse).
- Display and customize axis grid lines in a diagram (Gridlines).
- Apply interlacing to a diagram (Interlaced).
- Customize general appearance settings (Appearance).
- Access the XY diagram to which the axis belongs (Diagram).
Terminal TdxChartCustomAxis Class Descendants
Do not use the TdxChartCustomAxis class directly. Use the following descendants instead:
- TdxChartAxisX
- Stores settings of the axis of arguments in an XY diagram.
- TdxChartAxisY
- Stores settings of the axis of values in an XY diagram.
Inheritance
See Also