TdxChartXYDiagram Class
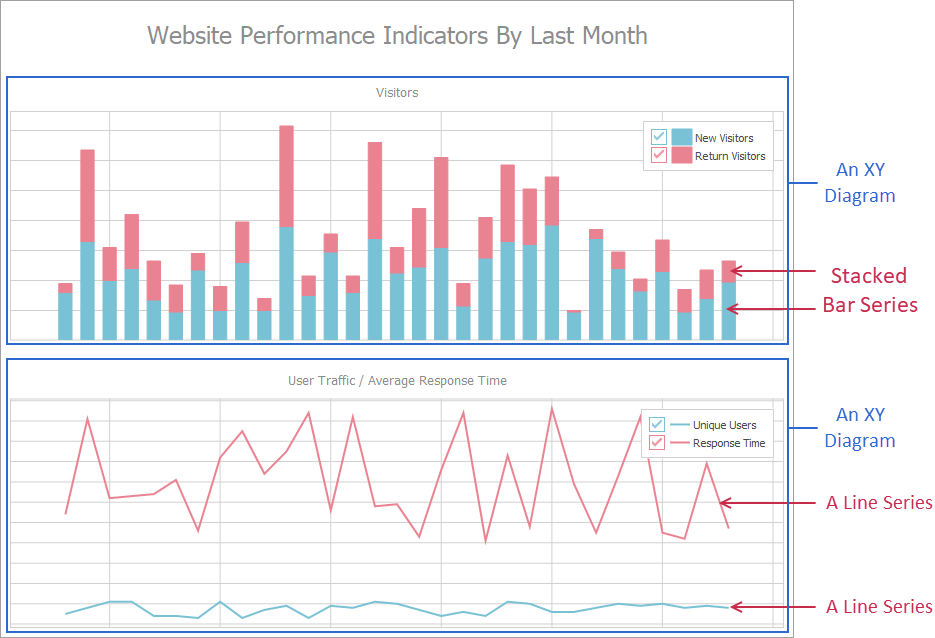
An XY diagram in the Chart control.
Declaration
TdxChartXYDiagram = class(
    TdxChartCustomDiagram
)
Remarks
An XY diagram is designed to display series using the axis of arguments (X-axis) and the axis of values (Y-axis) that form a two-dimensional Cartesian coordinate system.
Supported XY Series Types
A series View determines how an XY diagram displays series.[1] A diagram can display multiple series with different Views and individual View appearance settings. You can use the ViewType or ViewClass property to switch between compatible Views in any existing series and display the same data in a different manner at any time.
Area Views
Area Views display series as filled areas on a diagram. Heights of peaks and hollows of filled areas reflect series point values. Area Views support the same line appearance settings for filled area borders as Line Views.
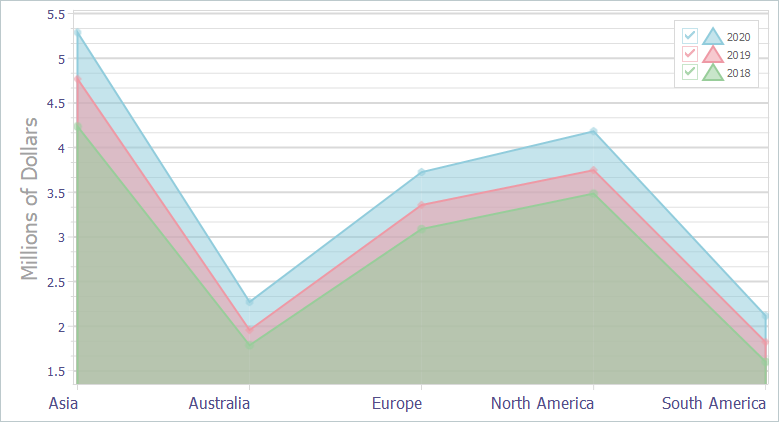
- Simple Area View
The Simple Area View displays series as filled overlapping areas on a diagram. Use this View when you display only one series or when you need to compare multiple series.
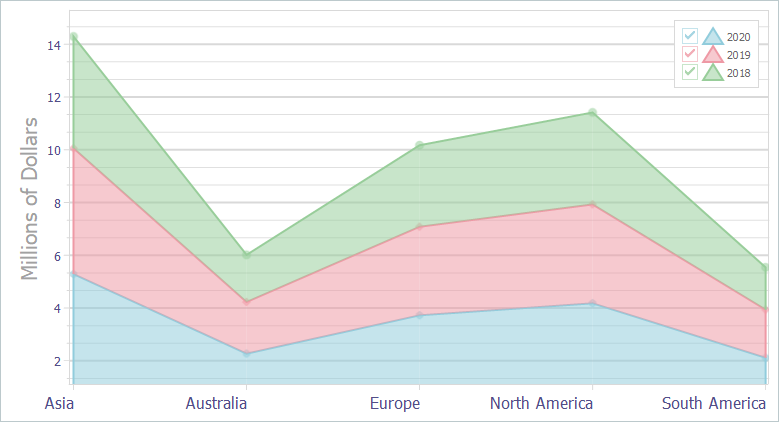
- Stacked Area View
The Stacked (Aggregated) Area View displays series as stacked areas on a diagram. Use this View when you display multiple series and you need to emphasize the total.
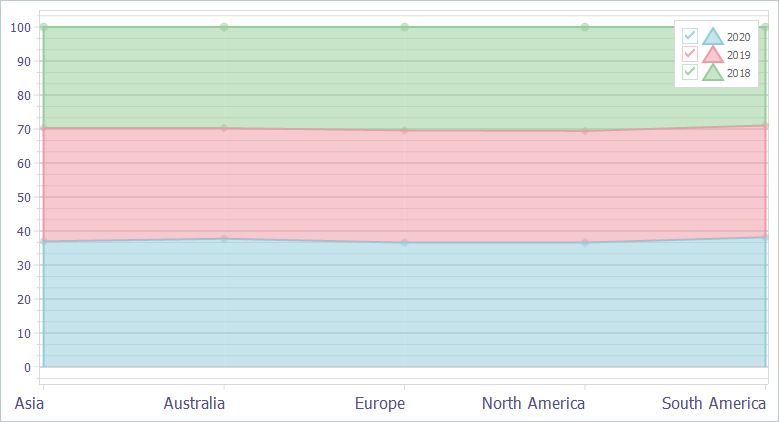
- Full-Stacked Area View
The Full-Stacked (100% Stacked) Area View displays series as stacked areas on a diagram. Unlike the Stacked Area View, stacked areas always occupy an entire diagram area by height, and the axis of values displays percentage values. Use this View when you display multiple series and you need to emphasize percentage contribution of each series.
Bar Views
Bar Views display series as sets of vertical or horizontal bars depending on axes positions. Bar lengths reflect series point values. Bar Views are often used to compare values in different categories.
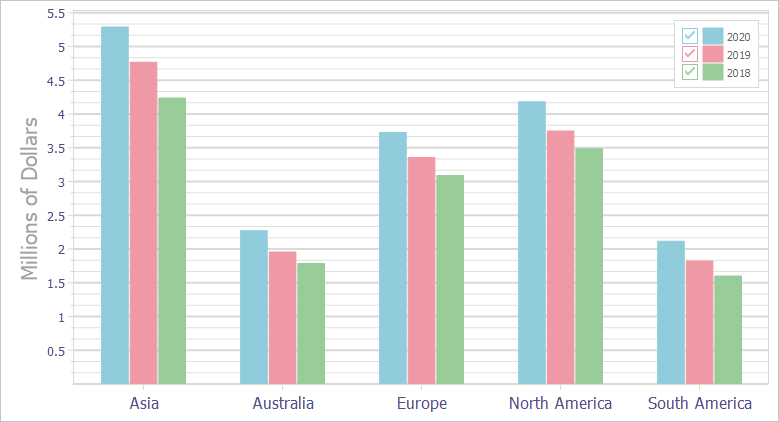
- Simple Bar View
The Simple Bar View displays series values as colored bars grouped by argument values (categories). Use this View when you display only one series or when you need to compare multiple series.
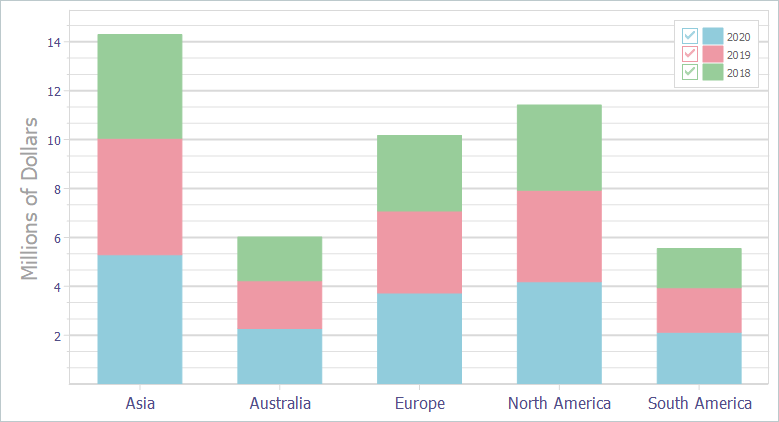
- Stacked Bar View
The Stacked Bar View displays all points from all series as colored bars stacked at argument values. Use this View when you display multiple series and you need to emphasize the total.
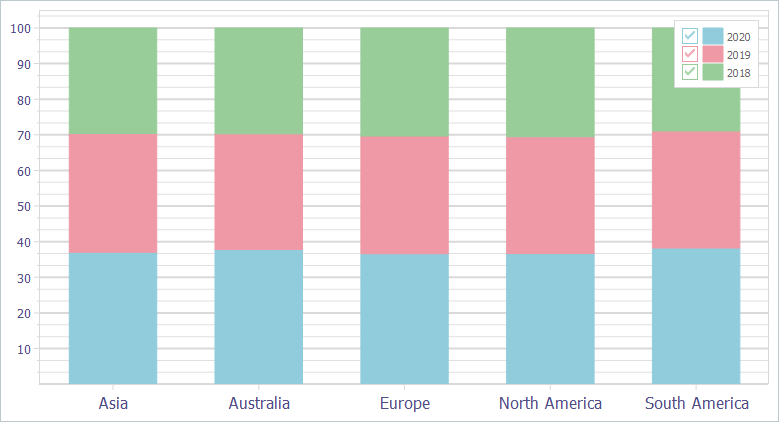
- Full-Stacked Bar View
The Full-Stacked (100% Stacked) Bar View displays all series as colored bars stacked at argument values. Use this View when you display multiple series and you need to emphasize percentage contribution of each series.
Line Views
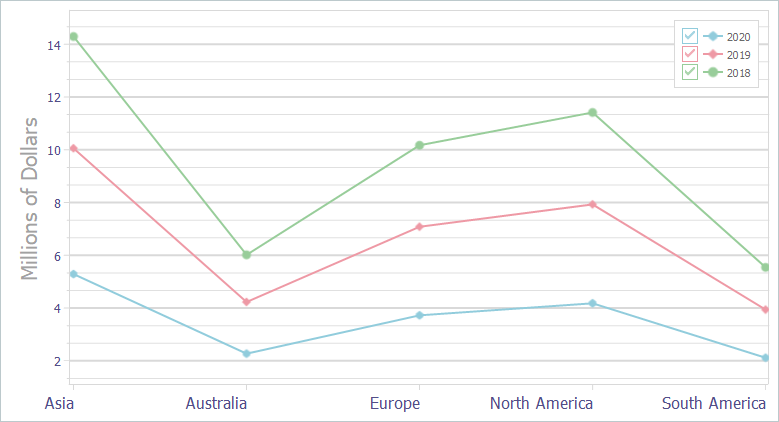
Line Views display series values as lines and/or points in any combination. Line Views are often used to show and compare multiple trends on the same diagram.
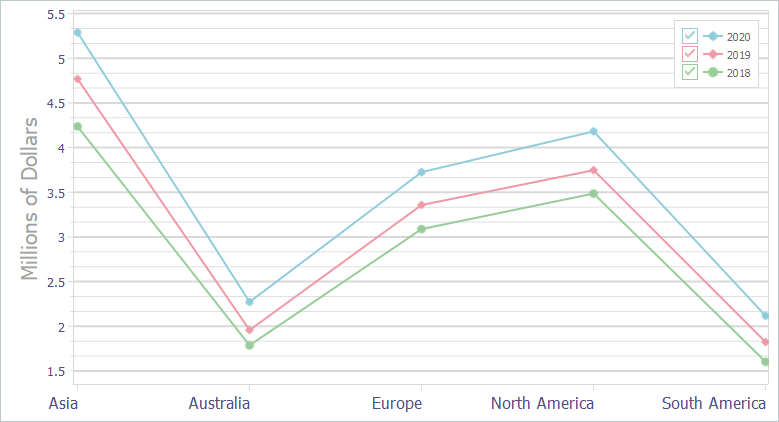
- Simple Line View
The Simple Line View displays series as colored lines on a diagram. Use this View when you display only one series or when you need to compare multiple series.
- Stacked Line View
The Stacked (Aggregated) Line View forms stacked empty areas from series lines on a diagram. Use this View when you display multiple series and you need to emphasize the total.
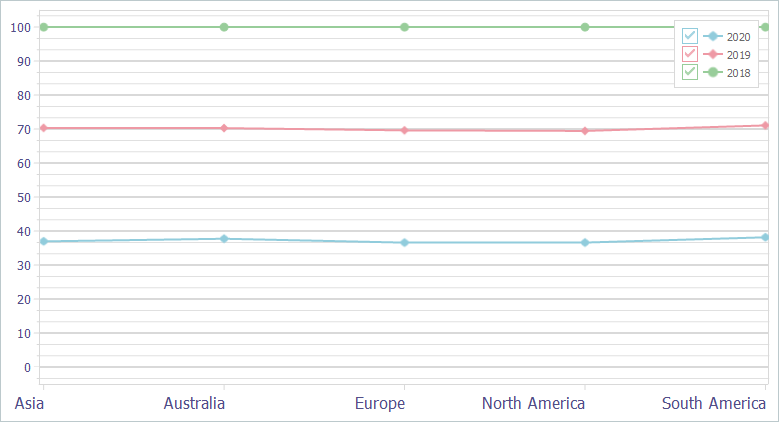
- Full-Stacked Line View
The Full-Stacked (100% Stacked) Line View divides an entire diagram area by height with series lines so all values of a series are stacked with the corresponding values of other series on the same diagram. Use this View when you display multiple series and you need to emphasize percentage contribution of each series.
Main API Members
The list below outlines key members of the TdxChartXYDiagram class that allow you to configure XY diagrams and manage series in them.
- Copy compatible settings between XY diagrams (Assign).
- Specify the diagram title and customize its appearance (Title).
- Obtain the total number of series and the number of visible series in the diagram (SeriesCount and VisibleSeriesCount).
- Customize diagram zoom and scroll settings (ZoomOptions and ScrollOptions).
- Prevent certain zoom operations in the diagram (OnBeforeZoom).
- Respond to zoom and scroll operations in the diagram (OnZoom and OnScroll).
- Display the diagram in full when it is zoomed in (ResetZoom).
- Zoom the diagram in code (ZoomIn and ZoomOut).
- Customize individual series and axis value labels (OnGetValueLabelDrawParameters and OnGetAxisValueLabelDrawParameters).
- Add a new series to the diagram (AddSeries).
- Access visible and hidden series by their indexes (VisibleSeries and Series).
- Swap positions of X and Y axes in the diagram (Rotated).
- Customize the diagram’s appearance settings (Appearance).
- Rearrange diagrams in a Chart control (Index).
- Access and customize X and Y axes (Axes).
- Hide or display the diagram (Visible).
- Perform the same set of actions on all series in the diagram (ForEachSeries).
- Customize the diagram’s legend settings (Legend).
- Avoid excessive redraw operations during batch data and appearance setting changes (BeginUpdate, CancelUpdate, and EndUpdate).
- Delete all series (DeleteAllSeries).
Code Examples
Bound Mode
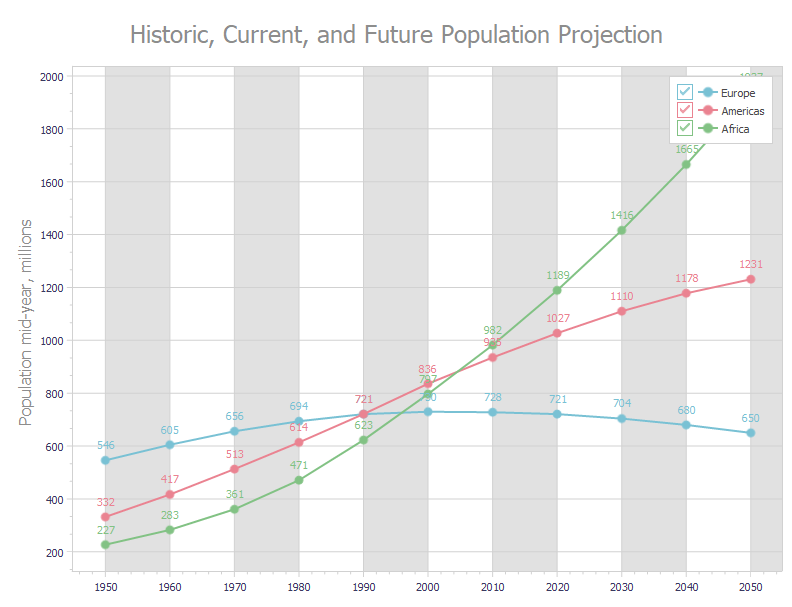
The following code example creates three line series with identical appearance settings in bound mode:
var
  AXYDiagram: TdxChartXYDiagram;
  AXYSeriesAmericas, AXYSeriesEurope, AXYSeriesAfrica: TdxChartXYSeries;
  ALineView: TdxChartXYSeriesLineView;
  ADataBinding: TdxChartXYSeriesDBDataBinding;
begin
  dxChartControl1.BeginUpdate;  // Initiates the following batch change
  try
    dxChartControl1.Titles.Add.Text := 'Historic, Current, and Future Population Projection';
    AXYDiagram := dxChartControl1.AddDiagram<TdxChartXYDiagram>;
    AXYDiagram.Axes.AxisY.Title.Text := 'Population mid-year, millions';
    AXYDiagram.Axes.AxisX.Interlaced := True;
    AXYSeriesEurope := AXYDiagram.AddSeries('Europe');  // Creates a new series with the caption "Europe"
    AXYSeriesEurope.ShowInLegend := TdxChartSeriesShowInLegend.Diagram;
    ADataBinding := AXYSeriesEurope.DataBinding as TdxChartXYSeriesDBDataBinding;
    ADataBinding.DataSource := dsPopulation;  // Assigns a data source
    ADataBinding.DataSource.DataSet := mdPopulation;  // Assigns a dataset
    ADataBinding.DataSource.DataSet.Active := True;  // Enables the assigned dataset
    ADataBinding.ArgumentField.FieldName := 'Year';  // Specifies the source dataset field for arguments
    ADataBinding.ValueField.FieldName := 'Europe';  // Specifies the source dataset field for values
    AXYSeriesEurope.ViewType := 'Line';  // Selects the Line series View
    ALineView := TdxChartXYSeriesLineView(AXYSeriesEurope.View);
    ALineView.Markers.Visible := True;  // Displays value markers
    ALineView.ValueLabels.Visible := True;  // Displays value labels
    ALineView.Appearance.StrokeOptions.Width := 2;  // Increases line width
    AXYSeriesAmericas := AXYDiagram.AddSeries;  // Creates a new series with the default settings
    AXYSeriesAmericas.AssignFrom(AXYSeriesEurope);  // Copies all settings from the "Europe" series
    AXYSeriesAmericas.Caption := 'Americas';  // Defines a different series caption
    // Specifies a different source dataset field for values
    TdxChartXYSeriesDBDataBinding(AXYSeriesAmericas).ValueField.FieldName := 'Americas';
    AXYSeriesAfrica := AXYDiagram.AddSeries;  // Creates a new series with the default settings
    AXYSeriesAfrica.AssignFrom(AXYSeriesEurope);  // Copies all settings from the "Europe" series
    AXYSeriesAfrica.Caption := 'Africa';  // Defines a different series caption
    // Specifies a different source dataset field for values
    TdxChartXYSeriesDBDataBinding(AXYSeriesAfrica).ValueField.FieldName := 'Africa';
  finally
    dxChartControl1.EndUpdate;  // Calls EndUpdate regardless of the batch operation's success
  end;
end;
Unbound Mode
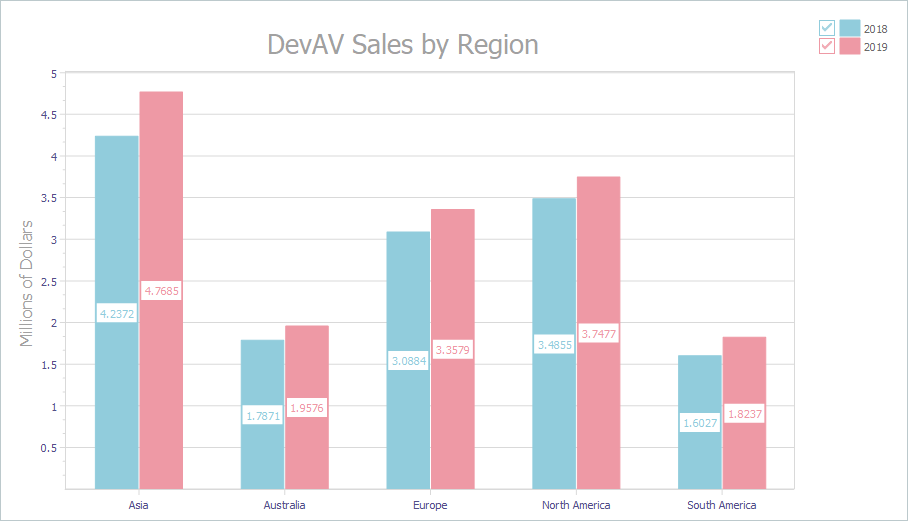
The following code example creates an XY diagram with two Bar chart series and populates them with data in unbound mode:
var
  AXYDiagram: TdxChartXYDiagram;
  AXYSeries: TdxChartXYSeries;
begin
  dxChartControl1.BeginUpdate;  // Initiates the following batch change
  try
    AXYDiagram := dxChartControl1.AddDiagram<TdxChartXYDiagram>('DevAV Sales by Region');
    AXYDiagram.Title.Appearance.FontOptions.Size := 20;
    AXYDiagram.Axes.AxisY.Title.Text := 'Millions of Dollars';
    AXYSeries := AXYDiagram.AddSeries('2018');  // Creates a new XY series with the caption "2018"
    AXYSeries.DataBindingType := 'Unbound';  // Selects the unbound data access mode
    TdxChartXYSeriesUnboundDataBinding(AXYSeries.DataBinding).ArgumentField.ValueType := 'string';
    AXYSeries.ViewType := 'Bar';  // Selects the Bar series View
    AXYSeries.Points.Add('Asia', 4.2372);
    AXYSeries.Points.Add('Australia', 1.7871);
    AXYSeries.Points.Add('Europe', 3.0884);
    AXYSeries.Points.Add('North America', 3.4855);
    AXYSeries.Points.Add('South America', 1.6027);
    AXYSeries.View.ValueLabels.Visible := True;  // Displays value labels on bars
    AXYSeries := AXYDiagram.AddSeries('2019');  // Creates a new XY series with the caption "2019"
    AXYSeries.DataBindingType := 'Unbound';  // Selects the unbound data access mode
    TdxChartXYSeriesUnboundDataBinding(AXYSeries.DataBinding).ArgumentField.ValueType := 'string';
    AXYSeries.ViewType := 'Bar';  // Selects the Bar series View
    AXYSeries.Points.Add('Asia', 4.7685);
    AXYSeries.Points.Add('Australia', 1.9576);
    AXYSeries.Points.Add('Europe', 3.3579);
    AXYSeries.Points.Add('North America', 3.7477);
    AXYSeries.Points.Add('South America', 1.8237);
    AXYSeries.View.ValueLabels.Visible := True;  // Displays value labels on bars
  finally
    dxChartControl1.EndUpdate;  // Calls EndUpdate regardless of the batch operation's success
  end;
end;
Delete a Diagram
To delete a diagram, release it directly in code (call the Free procedure in Delphi or use the delete keyword in C++Builder).
Direct TdxChartXYDiagram Class References
The Chart control’s Diagrams and VisibleDiagrams properties reference the TdxChartXYDiagram class as a TdxChartCustomDiagram object. You need to cast it to the TdxChartXYDiagram class to access all public API members.