TdxChartXYSeriesLineView Class
Stores Line View settings.
Declaration
TdxChartXYSeriesLineView = class(
    TdxChartXYSeriesCustomView
)
Remarks
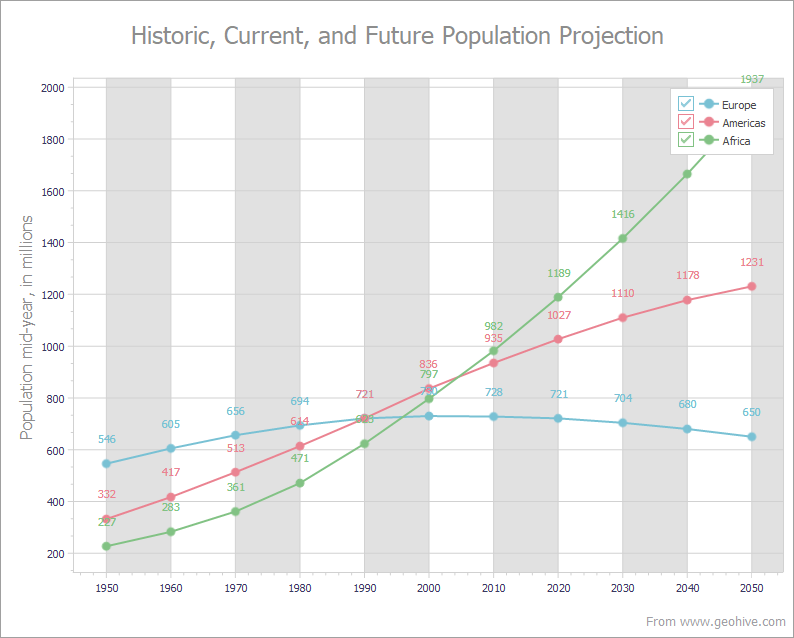
A Line View displays series values as lines and/or points in any combination. Line Views are often used to show and compare multiple trends on the same diagram.
The TdxChartXYSeriesLineView class implements the Simple Line View designed for demonstration of one series or comparison of multiple trends. To select the Simple Line View, assign 'Line' to the ViewType property of an XY series.
Main API Members
The list below outlines key members of the TdxChartXYSeriesLineView class that allow you to customize appearance of an XY series that uses the Simple Line View.
- Customize line appearance (Appearance).
- Display value markers and change their size, shape, and color (Markers).
- Switch between levels of line draw performance optimization (Optimization).
- Obtain the series View description (GetDescription).
- Display and customize value labels (ValueLabels).
- Access the series to which the current Line View settings belong (Series).
Direct TdxChartXYSeriesLineView Class References
The View property of an XY series references the TdxChartXYSeriesLineView class as a TdxChartSeriesCustomView object if the ViewType property of the series is set to 'Line'. You need to cast the returned object to the TdxChartXYSeriesLineView class to access all public API members.