Configure a Report in the Visual Studio Designer
- 5 minutes to read
This help topic explains how to generate a data-bound report in the DevExpress Report Designer for Visual Studio and then display it in the PDF Viewer for .NET MAUI.

Prerequisites
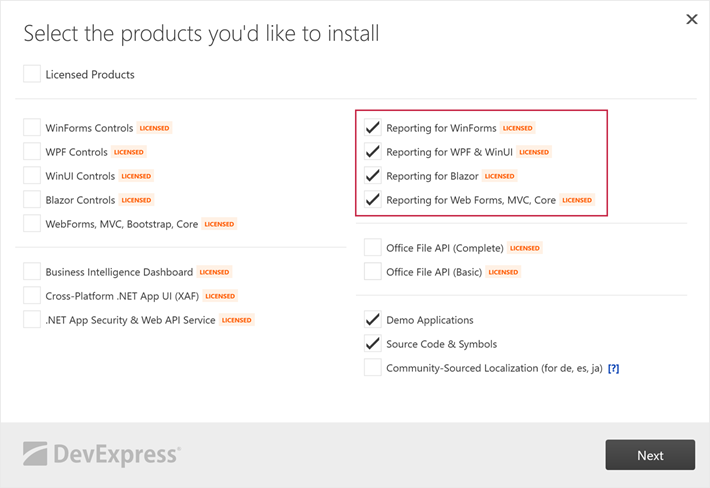
To use the Report Designer in the Visual Studio, ensure that the DevExpress components installer has at least one of Reporting for options selected:
Create a .NET MAUI App
Follow instructions in the following section to create an app with our .NET MAUI components included: Create Your First App with DevExpress Mobile UI for .NET MAUI (Visual Studio for Windows). Name the project MauiReportingApp.
Note that the DevExpress library for .NET MAUI targets only Android and iOS platforms (See also: Supported Platforms).
Add a Windows Targeting Project
You need to add an auxiliary project to use the Report Designer in your solution that includes a .NET MAUI project. The Report Designer can run in projects that target net8.0 or net8.0-windows; meanwhile, DevExpress controls for .NET MAUI only target net8.0-ios and net8.0-android.
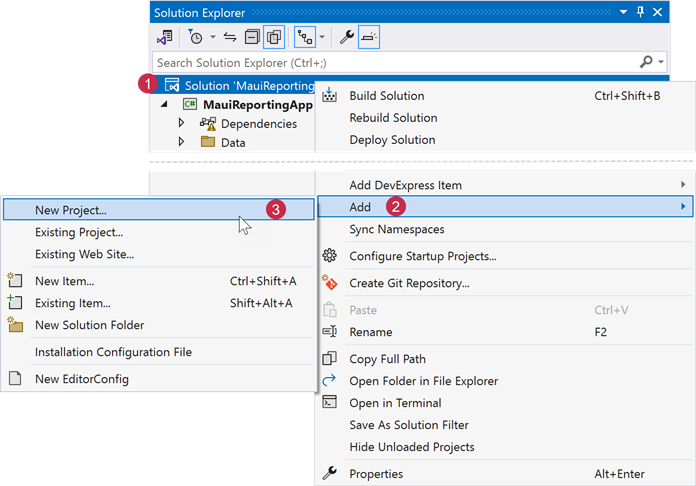
Right-click the solution in the Solution Explorer, select Add → New Project…:
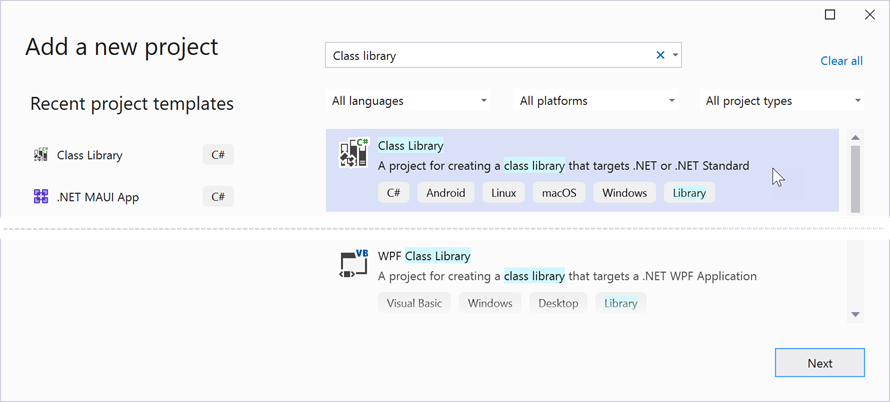
Select the Class Library project template and click Next:
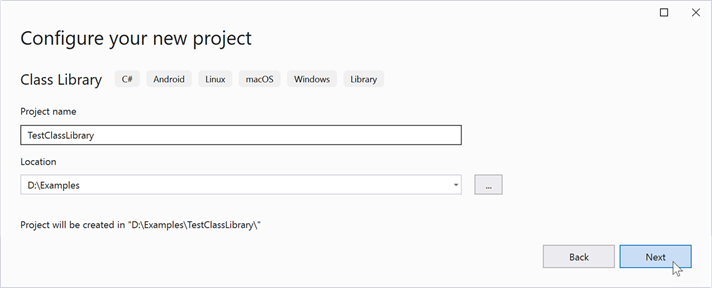
Name the newly-created project as TestClassLibrary and click Next:
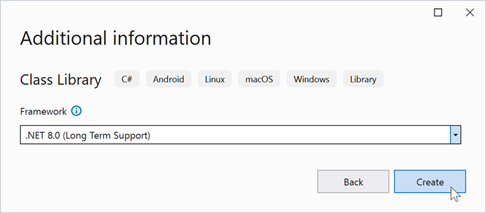
On the next page, select the .NET 8.0 framework and click Create:
Add a Report Item to the Project
Follow steps in this section to generate a report in the Report Designer.
Add the DevExpress.Reporting.Core NuGet package to the TestClassLibrary project.
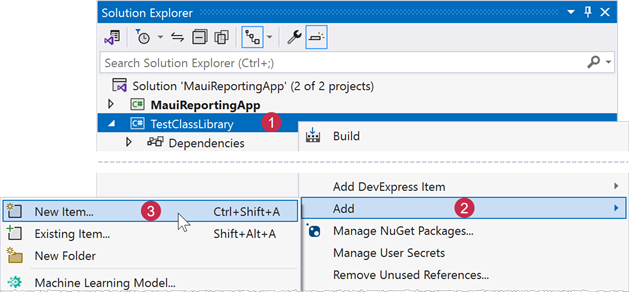
Right-click the TestClassLibrary project in the Solution Explorer, select Add → New Item…:
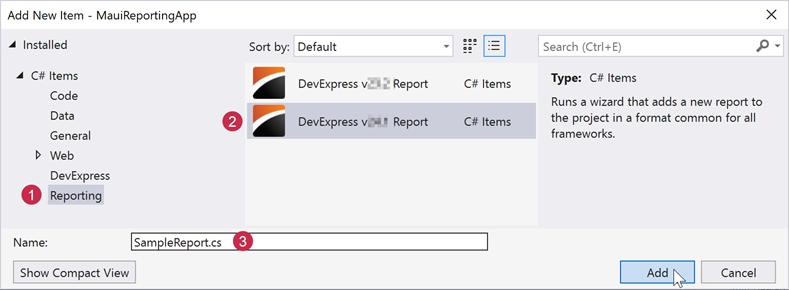
Select the DevExpress v25.2 Report template and name the resulting report class as SampleReport.
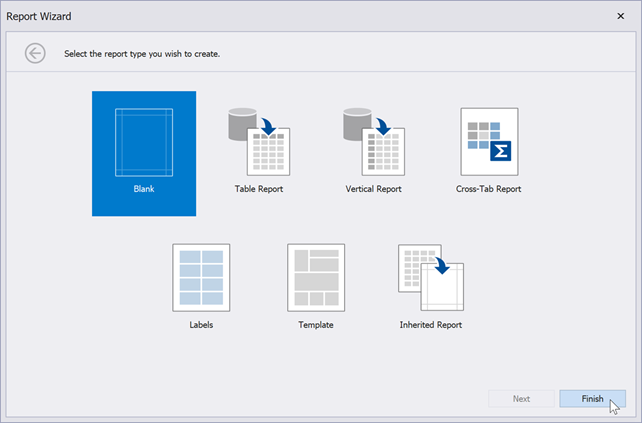
After the report class is created, the Report Wizard is invoked. Select the Blank option and click Finish.
This will display a Report Designer with a blank report. The designer surface is broken down into bands that help you build report flow. A band can appear at the beginning or end of the report, on every printed page, once for each data record, and so on.
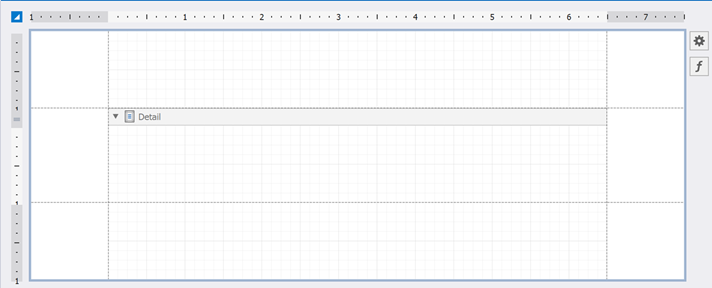
Generate a Report
In this tutorial, a report will be generated based on a list of data items (CountryDataSource). Create a Data folder with CountryDataSource and CountryData classes in it.
namespace MauiReportingApp.Data {
   public class CountryDataSource : List<CountryData> {
       public CountryDataSource() {
           List<CountryData> sales = new List<CountryData>() {
               new CountryData(1, 0, "Norway", 385207),
               new CountryData(2, 0, "Sweden", 528447),
               new CountryData(3, 0, "Denmark", 42951),
               new CountryData(4, 0, "Finland", 338455),
               new CountryData(5, 0, "Iceland", 103000),
               new CountryData(6, 0, "Ireland", 84421),
               new CountryData(7, 0, "United Kingdom", 243610),

               new CountryData(18, 17, "Spain", 505990),
               new CountryData(19, 17, "Portugal", 92212),
               new CountryData(20, 17, "Greece", 131957),
               new CountryData(21, 17, "Italy", 301230),
               new CountryData(22, 17, "Malta", 316),
               new CountryData(23, 17, "San Marino", 61.2),
               new CountryData(25, 17, "Serbia", 88499),

               new CountryData(27, 26, "USA", 9522055),
               new CountryData(28, 26, "Canada", 9984670),

               new CountryData(30, 29, "Argentina", 2780400),
               new CountryData(31, 29, "Brazil", 8514215),

               new CountryData(34, 32, "India", 3287263),
               new CountryData(35, 32, "Japan", 377975),
               new CountryData(36, 32, "China", 9597000)
           };
           this.AddRange(sales);
       }
   }
}
namespace MauiReportingApp.Data {
   public class CountryData {
       public CountryData(int regionId, int parentRegionId, string region, double area) {
           RegionID = regionId;
           ParentRegionID = parentRegionId;
           Region = region;
           Area = area;
       }
       public int RegionID { get; set; }
       public int ParentRegionID { get; set; }
       public string Region { get; set; }
       public double Area { get; set; }
   }
}
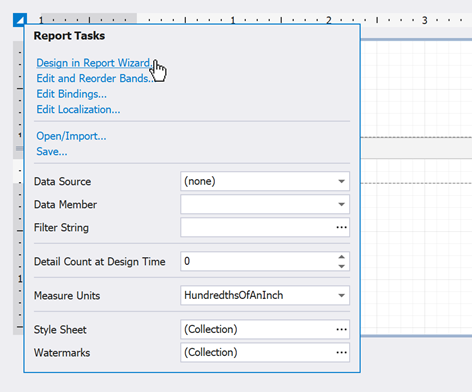
Click the report’s smart tag and run the Design in Report Wizard… action to run the Report Wizard:
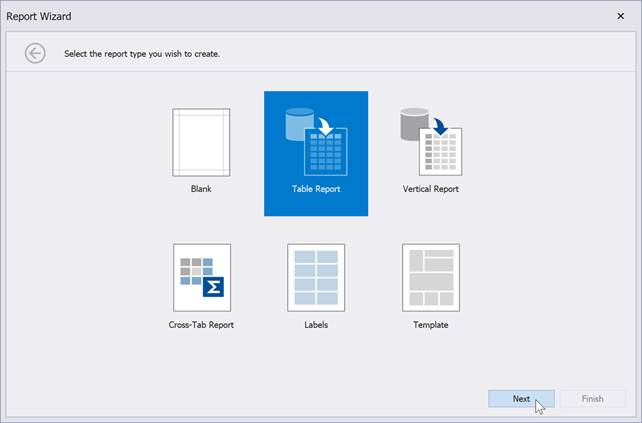
Select the Table Report option and click Next:
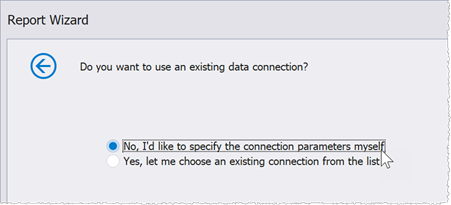
On the next page, select No, I’d like to specify the connection parameters myself and click Next:
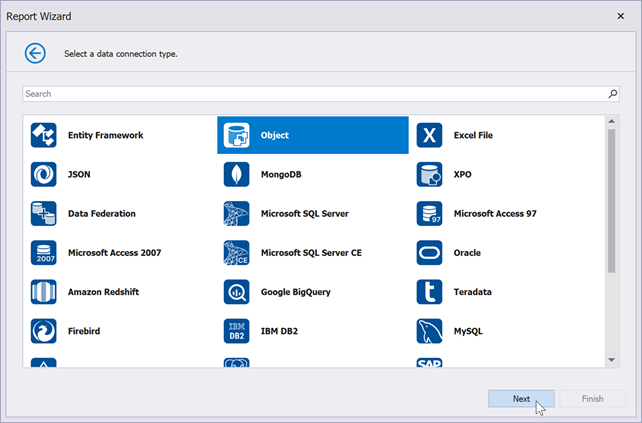
Select the Object data connection type:
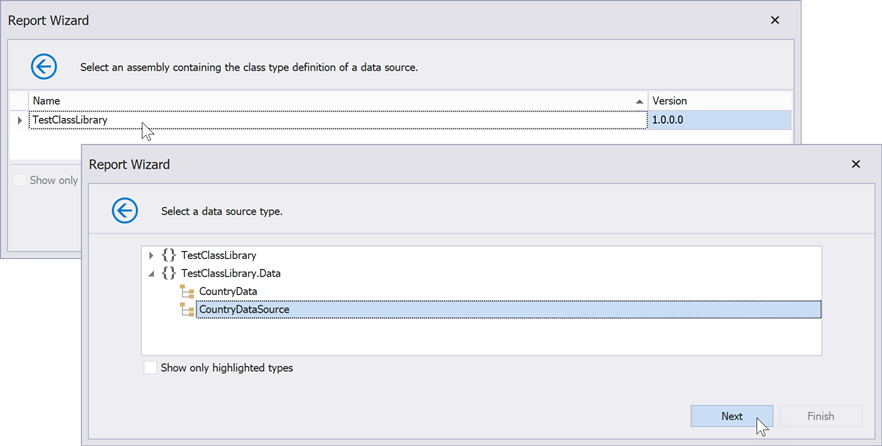
On the next page, double-click the TestClassLibrary assembly and, on the next page, select the CountryDataSource data source type:
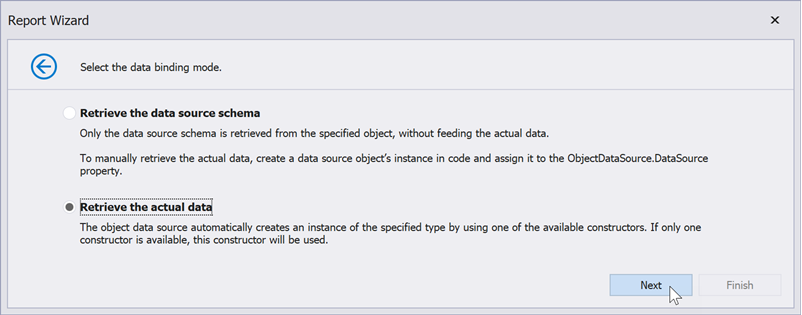
Select the Retrieve the actual data option and click Next:
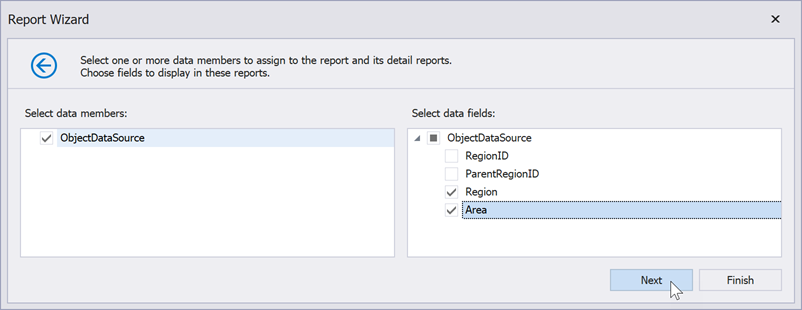
On the next page, choose the Region and Area data source fields that contain data for table columns:
Click Next to skip grouping configuration. Generally, you can select a separate data field by which table rows should be grouped.
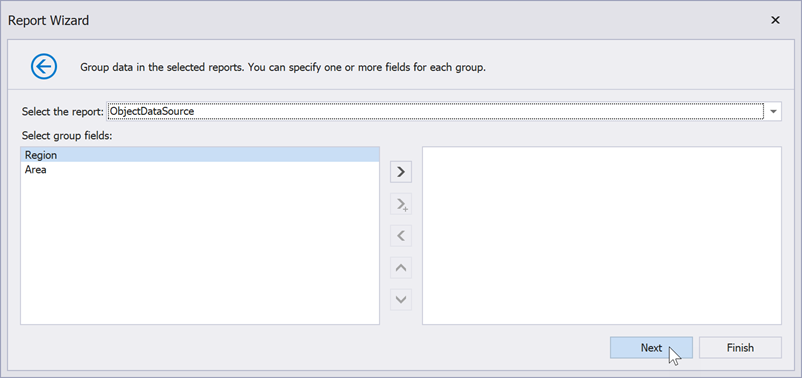
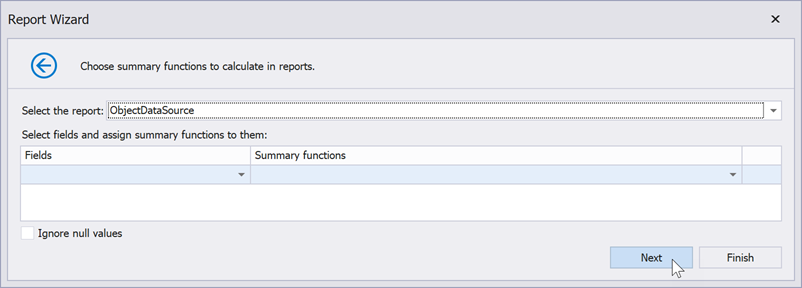
On the next page, click Next to skip summary configuration:
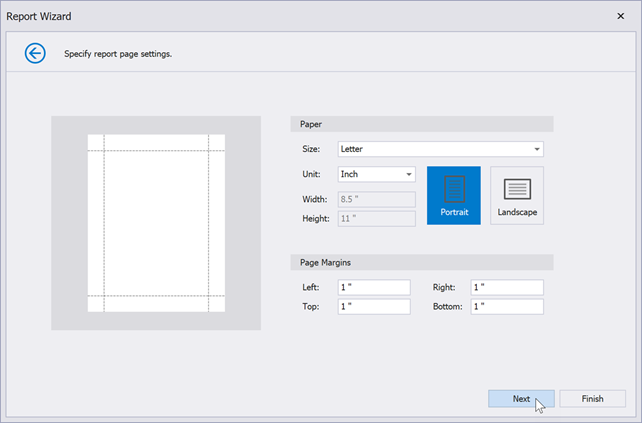
Specify report page settings and click Next:
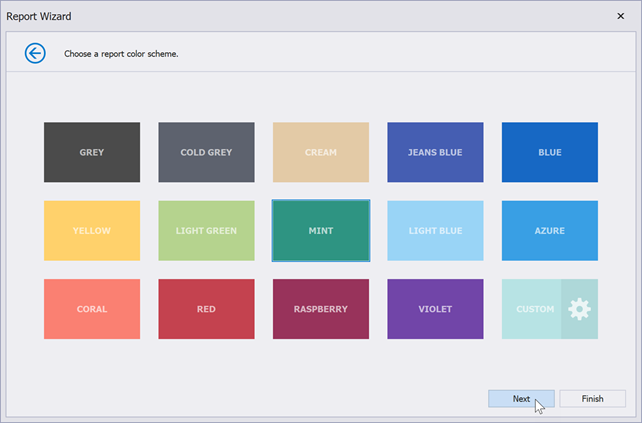
On the following page, select the report accent color and click Next:
Type the report title and click Finish:

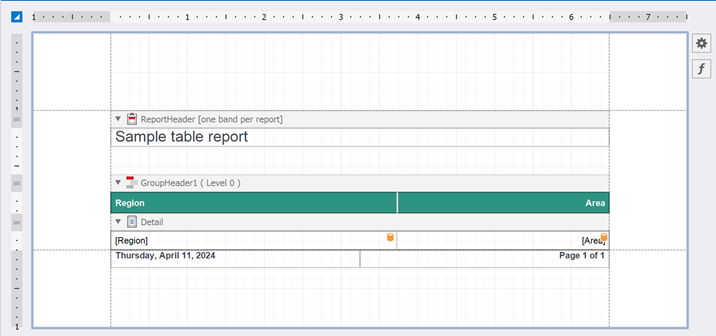
The resulting report layout looks as follows:
Show Report in PDF Viewer
In this tutorial, the resulting report is converted to a PDF file and then displayed in the DevExpress PDF viewer for .NET MAUI. Follow the steps below to convert the report to PDF and display it in the PDF viewer:
Right-click the MauiReportingApp in the Solution Explorer, click Add → Project Reference…:
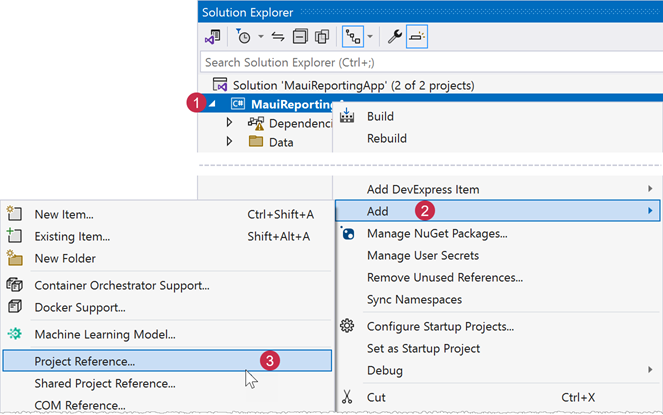
In the Reference Manager, select TestClassLibrary and click OK:

Add the PdfViewer component to the page. For more information, refer to the following section: Add a PDF Viewer to the Page.
<ContentPage ...
            xmlns:dx="http://schemas.devexpress.com/maui">
    <dx:PdfViewer x:Name="pdfViewer"/>
</ContentPage>
Add the following code to the MainPage constructor to create a report, convert it to a PDF file, and open that file in the PDF Viewer:
using DevExpress.Maui.Pdf;
using DevExpress.XtraReports.UI;
//...
    public MainPage() {
        InitializeComponent();

        SampleReport report = new SampleReport() { Name = "Sample" };
        report.CreateDocument();

        string resultFile = Path.Combine(FileSystem.Current.AppDataDirectory, report.Name + ".pdf");
        report.ExportToPdf(resultFile);

        pdfViewer.DocumentSource = PdfDocumentSource.FromFile(resultFile);
    }
Run the project to see the results:

Next Steps
To learn more about reports, refer to the following help topics in the Reporting section: