Get Started with Cartesian Chart for .NET MAUI
- 6 minutes to read
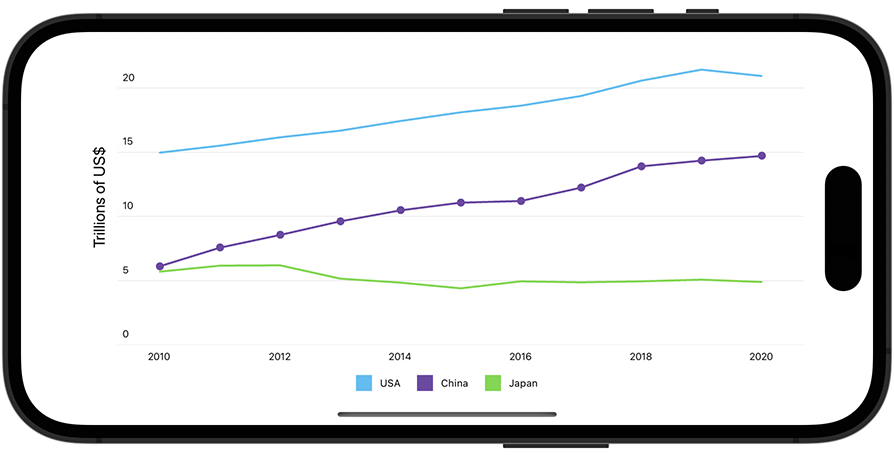
This topic explains how to create a sample application that uses the ChartView to visualize values of the gross domestic product (GDP) for several countries over the past decade.
Create a Project
Create a new .NET MAUI project. Name it ScatterChartGetStarted.
If the wizard does not suggest a template for .NET MAUI projects, you can call the following command in a CLI to create a new .NET MAUI project:
dotnet new maui -n ScatterChartGetStartedRegister your personal NuGet package source in Visual Studio. See the following topic for information on how to add the DevExpress NuGet feed to Visual Studio: Get Started with DevExpress Controls for .NET Multi-platform App UI (.NET MAUI).
If you are an active DevExpress Universal customer, DevExpress Controls for .NET MAUI are available in your personal NuGet feed.
- Install the DevExpress.Maui.Charts package from this feed.
Note
DevExpress Scatter Chart for .NET MAUI supports iOS and Android. The project should contain only these platforms.
Add a Scatter Chart to the Main Page
In the MauiProgram.cs file, call UseDevExpress and UseDevExpressCharts methods to register a handler for the ChartView class.
using Microsoft.Maui;
using Microsoft.Maui.Hosting;
using Microsoft.Maui.Controls.Hosting;
using DevExpress.Maui.Charts;

namespace ScatterChartGetStarted {
    public static class MauiProgram {
        public static MauiApp CreateMauiApp() {
            var builder = MauiApp.CreateBuilder();
            builder
                .UseMauiApp<App>()
                .UseDevExpress()
                .UseDevExpressCharts()
                .ConfigureFonts(fonts => {
                    fonts.AddFont("OpenSans-Regular.ttf", "OpenSansRegular");
                });
            return builder.Build();
        }
    }
}
In the MainPage.xaml file, define the dx XAML namespace. Then, remove the default content and add an instance of the ChartView class to the page.
<ContentPage xmlns="http://schemas.microsoft.com/dotnet/2021/maui"
             xmlns:x="http://schemas.microsoft.com/winfx/2009/xaml"
             xmlns:dx="http://schemas.devexpress.com/maui"
             x:Class="ScatterChartGetStarted.MainPage">
    <dxc:ChartView/>
</ContentPage>
You may also need to remove the default content’s event handlers in the code-behind. We recommend that you remove the default styles (fonts, colors, and other settings) in the App.xaml file.
Populate the Chart with Data
In this example, the chart contains line series that show annual GDP for three countries. Create a ViewModel.cs file with the following classes:
public class ViewModel {
    public CountryGdp GdpValueForUSA { get; }
    public CountryGdp GdpValueForChina { get; }
    public CountryGdp GdpValueForJapan { get; }

    public ViewModel() {
        GdpValueForUSA = new CountryGdp(
            "USA",
            new GdpValue(new DateTime(2020, 1, 1), 20.93),
            new GdpValue(new DateTime(2019, 1, 1), 21.43),
            new GdpValue(new DateTime(2018, 1, 1), 20.58),
            new GdpValue(new DateTime(2017, 1, 1), 19.391),
            new GdpValue(new DateTime(2016, 1, 1), 18.624),
            new GdpValue(new DateTime(2015, 1, 1), 18.121),
            new GdpValue(new DateTime(2014, 1, 1), 17.428),
            new GdpValue(new DateTime(2013, 1, 1), 16.692),
            new GdpValue(new DateTime(2012, 1, 1), 16.155),
            new GdpValue(new DateTime(2011, 1, 1), 15.518),
            new GdpValue(new DateTime(2010, 1, 1), 14.964)
        );
        GdpValueForChina = new CountryGdp(
            "China",
            new GdpValue(new DateTime(2020, 1, 1), 14.72),
            new GdpValue(new DateTime(2019, 1, 1), 14.34),
            new GdpValue(new DateTime(2018, 1, 1), 13.89),
            new GdpValue(new DateTime(2017, 1, 1), 12.238),
            new GdpValue(new DateTime(2016, 1, 1), 11.191),
            new GdpValue(new DateTime(2015, 1, 1), 11.065),
            new GdpValue(new DateTime(2014, 1, 1), 10.482),
            new GdpValue(new DateTime(2013, 1, 1), 9.607),
            new GdpValue(new DateTime(2012, 1, 1), 8.561),
            new GdpValue(new DateTime(2011, 1, 1), 7.573),
            new GdpValue(new DateTime(2010, 1, 1), 6.101)
        );
        GdpValueForJapan = new CountryGdp(
            "Japan",
            new GdpValue(new DateTime(2020, 1, 1), 4.888),
            new GdpValue(new DateTime(2019, 1, 1), 5.082),
            new GdpValue(new DateTime(2018, 1, 1), 4.955),
            new GdpValue(new DateTime(2017, 1, 1), 4.872),
            new GdpValue(new DateTime(2016, 1, 1), 4.949),
            new GdpValue(new DateTime(2015, 1, 1), 4.395),
            new GdpValue(new DateTime(2014, 1, 1), 4.850),
            new GdpValue(new DateTime(2013, 1, 1), 5.156),
            new GdpValue(new DateTime(2012, 1, 1), 6.203),
            new GdpValue(new DateTime(2011, 1, 1), 6.156),
            new GdpValue(new DateTime(2010, 1, 1), 5.700)
        );
    }
}

public class CountryGdp {
    public string CountryName { get; }
    public IList<GdpValue> Values { get; }

    public CountryGdp(string country, params GdpValue[] values) {
        this.CountryName = country;
        this.Values = new List<GdpValue>(values);
    }
}

public class GdpValue {
    public DateTime Year { get; }
    public double Value { get; }

    public GdpValue(DateTime year, double value) {
        this.Year = year;
        this.Value = value;
    }
}
In the MainPage.xaml file, add three LineSeries objects to the ChartView.Series collection. To bind series to data, set each LineSeries object’s Data property to a SeriesDataAdapter object. Use the adapter’s properties to specify the data source and fields that contain arguments and values for each series.
You should also define the local XAML namespace that refers to a CLR namespace that contains the view model. Then, use the page’s BindingContext property to associate the view model with the view.
<ContentPage xmlns="http://schemas.microsoft.com/dotnet/2021/maui"
             xmlns:x="http://schemas.microsoft.com/winfx/2009/xaml"
             xmlns:dx="http://schemas.devexpress.com/maui"
             xmlns:local="clr-namespace:ScatterChartGetStarted"
             x:Class="ScatterChartGetStarted.MainPage">
    <ContentPage.BindingContext>
        <local:ViewModel/>
    </ContentPage.BindingContext>
    <dx:ChartView>
        <dx:ChartView.Series>
            <dx:LineSeries DisplayName="{Binding GdpValueForUSA.CountryName}">
                <dx:LineSeries.Data>
                    <dx:SeriesDataAdapter DataSource="{Binding GdpValueForUSA.Values}"
                                          ArgumentDataMember="Year">
                        <dx:ValueDataMember Type="Value" Member="Value"/>
                    </dx:SeriesDataAdapter>
                </dx:LineSeries.Data>
            </dx:LineSeries>

            <dx:LineSeries DisplayName="{Binding GdpValueForChina.CountryName}">
                <dx:LineSeries.Data>
                    <dx:SeriesDataAdapter DataSource="{Binding GdpValueForChina.Values}"
                                          ArgumentDataMember="Year">
                        <dx:ValueDataMember Type="Value" Member="Value"/>
                    </dx:SeriesDataAdapter>
                </dx:LineSeries.Data>
            </dx:LineSeries>

            <dx:LineSeries DisplayName="{Binding GdpValueForJapan.CountryName}">
                <dx:LineSeries.Data>
                    <dx:SeriesDataAdapter DataSource="{Binding GdpValueForJapan.Values}"
                                          ArgumentDataMember="Year">
                        <dx:ValueDataMember Type="Value" Member="Value"/>
                    </dx:SeriesDataAdapter>
                </dx:LineSeries.Data>
            </dx:LineSeries>
        </dx:ChartView.Series>
    </dx:ChartView>
</ContentPage>
Configure Chart Axes
Configure the X-axis so that it shows labels for years. Assign a DateTimeAxisX object with the specified settings to the ChartView.AxisX property.
<dx:ChartView>
    <dx:ChartView.AxisX>
        <dx:DateTimeAxisX MeasureUnit="Year"
                          GridAlignment="Year"
                          GridSpacing="2"/>
    </dx:ChartView.AxisX>
</dx:ChartView>
Configure the title and labels on the Y-axis. Set the ChartView.AxisY property to a NumericAxisY object and specify this object’s Title and Label properties.
<dx:ChartView>
<!-- The X-axis config is here. -->
    <dx:ChartView.AxisY>
        <dx:NumericAxisY>
            <dx:NumericAxisY.Title>
                <dx:AxisTitle Text="Trillions of US$">
                    <dx:AxisTitle.Style>
                        <dx:TitleStyle>
                            <dx:TitleStyle.TextStyle>
                                <dx:TextStyle Size="16"/>
                            </dx:TitleStyle.TextStyle>
                        </dx:TitleStyle>
                    </dx:AxisTitle.Style>
                </dx:AxisTitle>
            </dx:NumericAxisY.Title>
            <dx:NumericAxisY.Label>
                <dx:AxisLabel TextFormat="#.#" Position="Inside"/>
            </dx:NumericAxisY.Label>
        </dx:NumericAxisY>
    </dx:ChartView.AxisY>
</dx:ChartView>
Add a Legend to the Chart
Configure the legend position and orientation. Set the ChartView.Legend property to a Legend object, and specify this object’s properties as follows:
<dx:ChartView>
    <dx:ChartView.Legend>
        <dx:Legend VerticalPosition="TopOutside"
                   HorizontalPosition="Center"
                   Orientation="LeftToRight"/>
    </dx:ChartView.Legend>
</dx:ChartView>
Enable a Crosshair Cursor
Set up the chart to display a series point hint as a crosshair cursor. Set the ChartView.Hint property to a Hint object and assign a CrosshairHintBehavior object to Hint.Behavior.
Then, specify the hint’s content, data format, and visibility options. Set the LineSeries.HintOptions property to a SeriesCrosshairOptions object with the specified settings.
<ContentPage.Resources>
    <dx:SeriesCrosshairOptions x:Key="lineSeriesHintOptions"
                               PointTextPattern="{}{S}: {V}M"
                               ShowInLabel="True"
                               AxisLabelVisible="True"
                               AxisLineVisible="True"/>
</ContentPage.Resources>
<dx:ChartView>
    <dx:ChartView.Hint>
        <dx:Hint>
            <dx:Hint.Behavior>
                <dx:CrosshairHintBehavior GroupHeaderTextPattern="{}{A$YYYY}"
                                          MaxSeriesCount="3"/>
            </dx:Hint.Behavior>
        </dx:Hint>
    </dx:ChartView.Hint>

    <dx:ChartView.Series>
        <dx:LineSeries HintOptions="{StaticResource lineSeriesHintOptions}">
            <!--Series Data-->
        </dx:LineSeries>
        <dx:LineSeries HintOptions="{StaticResource lineSeriesHintOptions}">
            <!--Series Data-->
        </dx:LineSeries>
        <dx:LineSeries HintOptions="{StaticResource lineSeriesHintOptions}">
            <!--Series Data-->
        </dx:LineSeries>
    </dx:ChartView.Series>
</dx:ChartView>
Modify the Chart Appearance
Set the LineSeries.MarkersVisible property to True to display point markers.
To change the line series appearance, set the LineSeries.Style property to a LineSeriesStyle object. This object’s Stroke, StrokeThickness, MarkerSize, and MarkerStyle properties allow you to configure the appearance of the series line and point markers.
<dx:LineSeries MarkersVisible="True">
    <!--Series Data-->
    <dx:LineSeries.Style>
        <dx:LineSeriesStyle Stroke="#7145a7" StrokeThickness="2" MarkerSize="8">
            <dx:LineSeriesStyle.MarkerStyle>
                <dx:MarkerStyle Fill="#7145a7"/>
            </dx:LineSeriesStyle.MarkerStyle>
        </dx:LineSeriesStyle>
    </dx:LineSeries.Style>
</dx:LineSeries>