Pie Chart
- 4 minutes to read
Short Description
The Pie Chart is represented by the PieSeriesView object, which belongs to Pie, Doughnut and Funnel Series Views. This view allows you to compare the percentage values of different point arguments in the same series, and to illustrate these values as easy-to-understand pie slices.
A Pie chart is shown in the image below. Note that if a chart contains multiple series of the PieSeriesView type, all series are displayed in the same diagram based on the SimpleDiagram.Dimension and SimpleDiagram.LayoutDirection property values.
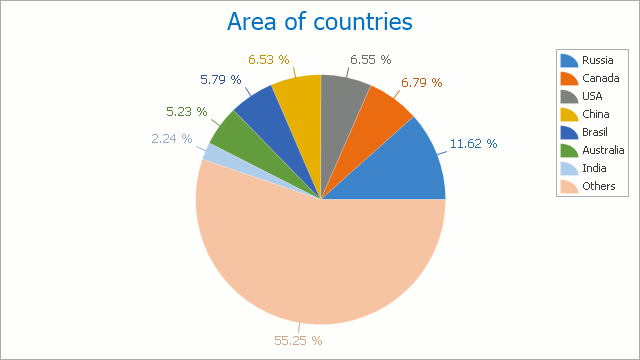
Chart Type Characteristics
The table below lists the main characteristics of this chart type.
| Feature | Value |
|---|---|
| Series View type | PieSeriesView |
| Diagram type | 2D-SimpleDiagram |
| Number of arguments per series point | 1 |
| Number of values per series point | 1 |
Note
For information on which chart types can be combined with the Pie Chart, refer to the following help topic: Combining Different Series Views.
Example
The following example creates a WebChartControl with a series of the PieSeriesView type and adds this chart to a form at runtime.

Before proceeding with this example, create a Web Forms Application in Visual Studio, and add all required assemblies to the project’s References list.
Then, add the following code to the page’s Load event handler:
using DevExpress.XtraCharts;
using DevExpress.XtraCharts.Web;
using System;
using System.Collections.Generic;

namespace PieChartSample {
    public partial class WebForm1 : System.Web.UI.Page {
        protected void Page_Load(object sender, EventArgs e) {
            // Create a WebChartControl instance:
            WebChartControl chart = new WebChartControl();
            chart.RenderFormat = RenderFormat.Svg;
            chart.Height = 450;
            chart.Width = 800;

            // Specify the chart palette:
            chart.PaletteName = Palettes.Slipstream.Name;

            // Create a Pie series and bind it to data:
            Series series = new Series("Pie", ViewType.Pie);
            series.DataSource = DataPoint.GetDataPoints();
            series.SetDataMembers("Argument", "Value");

            // Format series labels:
            series.Label.TextPattern = "{VP:p0} ({V:.##}M km²)";

            // Format series legend items:
            series.LegendTextPattern = "{A}";

            // Adjust series label position:
            ((PieSeriesLabel)series.Label).Position = PieSeriesLabelPosition.TwoColumns;

            // Resolve label overlaps:
            ((PieSeriesLabel)series.Label).ResolveOverlappingMode = ResolveOverlappingMode.Default;

            // Access series view options:
            PieSeriesView seriesView = (PieSeriesView)series.View;

            // Specify a data filter to explode points:
            seriesView.ExplodedPointsFilters.Add(new SeriesPointFilter(SeriesPointKey.Value_1,
                DataFilterCondition.GreaterThanOrEqual, 9));
            seriesView.ExplodedPointsFilters.Add(new SeriesPointFilter(SeriesPointKey.Argument,
                DataFilterCondition.NotEqual, "Others"));
            seriesView.ExplodeMode = PieExplodeMode.UseFilters;
            seriesView.ExplodedDistancePercentage = 30;
            seriesView.RuntimeExploding = true;

            chart.Series.Add(series);
            this.Controls.Add(chart);
        }
    }
    public class DataPoint {
        public string Argument { get; set; }
        public double Value { get; set; }
        public static List<DataPoint> GetDataPoints() {
            return new List<DataPoint> {
                    new DataPoint { Argument = "Russia",    Value = 17.0752},
                    new DataPoint { Argument = "Canada",    Value = 9.98467},
                    new DataPoint { Argument = "USA",       Value = 9.63142},
                    new DataPoint { Argument = "China",     Value = 9.59696},
                    new DataPoint { Argument = "Brazil",    Value = 8.511965},
                    new DataPoint { Argument = "Australia", Value = 7.68685},
                    new DataPoint { Argument = "India",     Value = 3.28759},
                    new DataPoint { Argument = "Others",    Value = 81.2}
                };
        }
    }
}