Bubble Chart
- 5 minutes to read
Short Description
The Bubble Chart is represented by the BubbleSeriesView object, which belongs to Point Series Views. In addition to other point diagram capabilities, this view allows you to visually represent data that has a third dimension (the BubbleLabelValueToDisplay.Weight of a series point), expressed in a bubble’s size. You can map two dimensions along the usual X and Y axes, and then the third dimension is displayed as a shape (a filled circle - “bubble”, a star, a triangle, etc.) at the data point. Also, you can use the BubbleSeriesView.MaxSize and BubbleSeriesView.MinSize properties of the series view to specify the size of the smallest and largest marker for the chart.
A Bubble chart example is shown in the image below. Note that this chart type is based upon the XYDiagram, so it can be rotated to change axis positions.
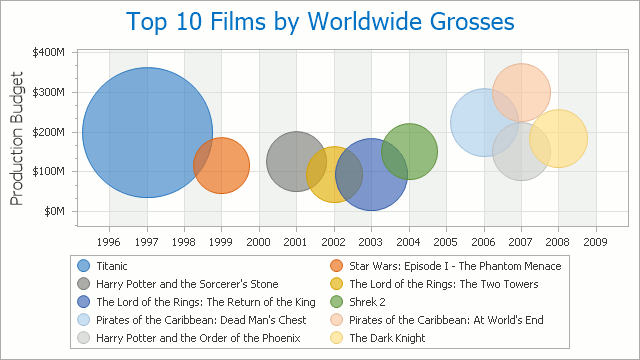
Chart Type Characteristics
The table below lists the main characteristics of this chart type.
| Feature | Value |
|---|---|
| Series View type | BubbleSeriesView |
| Diagram type | 2D-XYDiagram |
| Number of arguments per series point | 1 |
| Number of values per series point | 2 (Value and Weight) |
Note
For information on chart types that can be combined with the Bubble Chart, refer to the following help topic: Series Views Compatibility.
Example
The following example creates a WebChartControl with BubbleSeriesView type series, and adds this chart to a form at runtime. Before proceeding with this example, create a Web Forms Application in Visual Studio and add all required assemblies to the project’s References list.
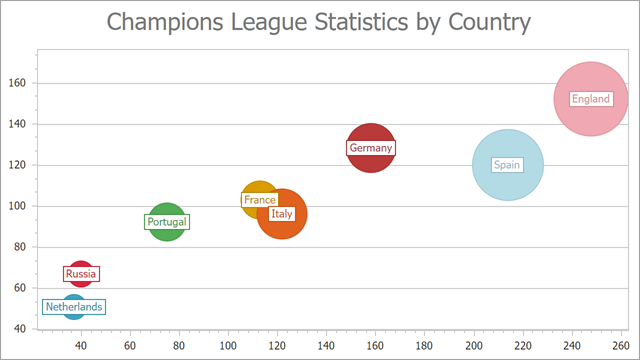
To draw a bubble chart similar to the chart above, create a bubble series and bind it to a data source in the Form’s Load event handler. Refer to the following topic for more information: How to: Bind an Individual Series to a Data Source (Runtime Sample).
Note that you need to specify two value data members for a bubble series: the first data member stores values that define the position of bubbles along a y-axis and the second data member – weight values that define the diameter of bubbles.
using DevExpress.XtraCharts;
using DevExpress.XtraCharts.Web;
using System;
using System.Collections.Generic;

namespace BubbleChart {
    public partial class WebForm1 : System.Web.UI.Page {
        protected void Page_Load(object sender, EventArgs e) {
            // Create a new chart.
            WebChartControl chart = new WebChartControl();
            chart.Height = 360;
            chart.Width = 640;
            chart.RenderFormat = RenderFormat.Svg;
            this.Controls.Add(chart);

            // Create a series.
            // Specify its data source and data members.
            Series series = new Series("Champions League Statistics", ViewType.Bubble);
            series.DataSource = DataPoint.GetDataPoints();
            series.ArgumentDataMember = "GoalsScored";
            series.ValueDataMembers.AddRange(new string[] { "GoalsConceded", "Points" });
            // You can also call the SetBubbleDataMembers method to specify data members.
            //series.SetBubbleDataMembers("GoalsScored", "GoalsConceded", "Points");
            chart.Series.Add(series);

            // Enable point labels and format their text.
            series.LabelsVisibility = DevExpress.Utils.DefaultBoolean.True;
            series.Label.TextPattern = "{Country}";

            // Configure the bubble series appearance.
            BubbleSeriesView view = (BubbleSeriesView)series.View;
            view.AutoSize = false;
            view.MaxSize = 30;
            view.MinSize = 10;
            view.BubbleMarkerOptions.Kind = MarkerKind.Circle;
            view.ColorEach = true;

            // Fine-tune the whole range to avoid trimmed bubbles and redundant empty spaces on the chart.
            XYDiagram diagram = chart.Diagram as XYDiagram;
            diagram.AxisY.WholeRange.MaxValue = 165;
            diagram.AxisY.WholeRange.AlwaysShowZeroLevel = false;

            // Specify titles.
            diagram.AxisX.Title.Text = "Goals Scored";
            diagram.AxisY.Title.Text = "Goals Conceded";
            chart.Titles.Add(new ChartTitle { Text = "Champions League Statistics by Country" });

            // Disable the legend.
            chart.Legend.Visibility = DevExpress.Utils.DefaultBoolean.False;
        }
    }
    public class DataPoint {
        public string Country { get; set; }
        public int GoalsScored { get; set; }
        public int GoalsConceded { get; set; }
        public int Points { get; set; }
        public DataPoint(string country, int goalsScored, int goalsConceded, int points) {
            this.Country = country;
            this.GoalsScored = goalsScored;
            this.GoalsConceded = goalsConceded;
            this.Points = points;
        }
        public static List<DataPoint> GetDataPoints() {
            List<DataPoint> data = new List<DataPoint> {
                new DataPoint("Netherlands", 37, 51, 36),
                new DataPoint("Russia", 40, 67, 43),
                new DataPoint("Portugal", 75, 92, 89),
                new DataPoint("France", 113, 103, 88),
                new DataPoint("Italy", 122, 96, 139),
                new DataPoint("Germany", 158, 128, 135),
                new DataPoint("Spain", 214, 120, 220),
                new DataPoint("England", 248, 152, 232)
            };
            return data;
        }
    }
}