Grid Spacing
- 3 minutes to read
Grid spacing is the distance between major grid lines. It is also a distance between major tickmarks or interlacing colors.

Automatic and Manual Grid Spacing
To determine the distance between major grid lines automatically, set the ScaleGridOptionsBase.AutoGrid property of your current scale to true. In this case, the grid is dynamically changed during zooming. When a user zooms in or out of the chart, grid spacing is adjusted automatically per the new magnification.
To determine the distance between major grid lines manually, configure the ScaleGridOptionsBase.GridSpacing property. Since GridSpacing can’t be set to 0 if its value is less than 1 (e.g., 0.1), it is always rounded to 1.
Note that after you assign a value to the GridSpacing property, the AutoGrid property becomes disabled. After you re-enable the AutoGrid property, this resets the GridSpacing property.
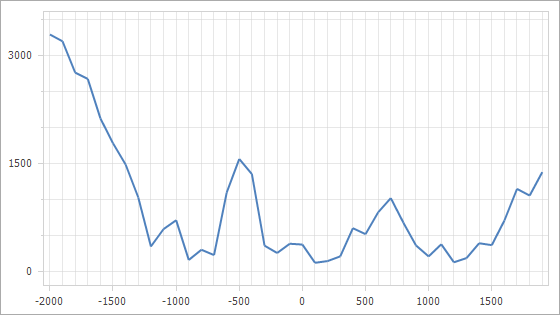
The following images demonstrate the GridSpacing property applied to the Y-axis:
Properties values | The resulting image |
|---|---|
AutoGrid = true |
|
AutoGrid = false GridSpacing = 200 |
|


For information on how to customize tickmarks and grid lines, refer to the following documents: Grid Lines, Tickmarks and Interlacing.
Grid Alignment vs Grid Spacing
You can use the GridAlignment and GridSpacing properties to customize the chart’s grid step.
For date-time and time-span axes, you can adjust the axis label’s display format using the AxisLabel.TextPattern property, because the GridAlignment value affects the axis label’s format. For example, axis labels show months if the GridAlignment is set to Month.
Option #1: GridSpacing = 1; GridAlignment = Year (for the x-axis)
Option #2: GridSpacing = 12; GridAlignment = Month; AxisLabel.TextPattern = “{A:yyyy}” (for the x-axis)
Result:

For numeric axes, the GridAlignment and GridSpacing property values are multiplied when they are used simultaneously and the result defines the grid step.
Option #1: GridSpacing = 5; GridAlignment = NumericGridAlignment.Hundreds (for the x-axis)
Option #2: GridSpacing = 500; GridAlignment = NumericGridAlignment.Ones (for the x-axis)
Result:
Update Grid Spacing Dynamically
You can handle the ChartControl.AxisScaleChanged event to obtain the axis‘ automatically calculated grid alignment and measurement unit values when the scale mode is automatic.
This example shows how to dynamically update the GridSpacing value at runtime to display no fractional values: