DXChart Class
The view that displays data in a Cartesian chart.
Namespace: DevExpress.Xamarin.iOS.Charts
Assembly: DevExpress.Xamarin.iOS.Charts.dll
Declaration
public class DXChart :
    DXChartBase
Remarks
The image below shows a Cartesian chart and highlights its major elements:
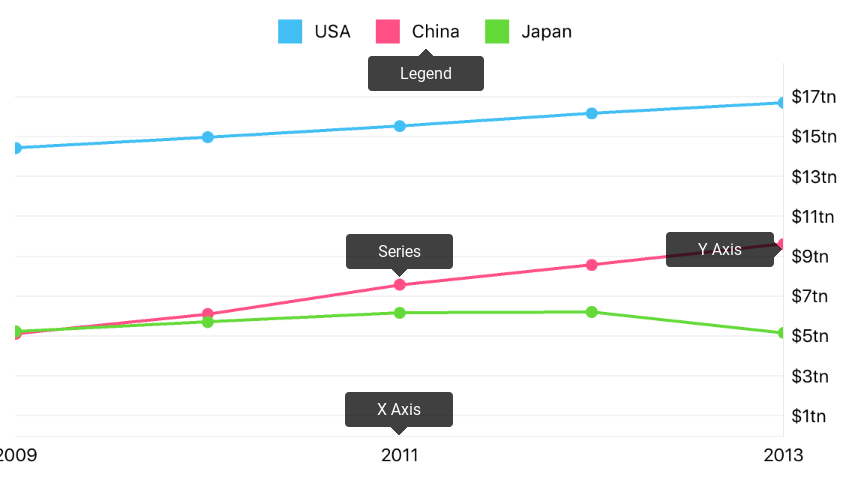
The following examples explain how to customize chart elements highlighted in the image above.
How to: Modify Chart Series
The Chart displays data Series provide. Series that inherit the DXSeries class are compatible with the Chart.
The following code snippet shows how to add a series to a chart:
this.chart.AddSeries(new DXLineSeries {
    Data = new GdpData(new List<Gdp> {
        new Gdp(year:2015, value:18.037),
        new Gdp(year:2014, value:17.393),
        new Gdp(year:2013, value:16.692),
        new Gdp(year:2012, value:16.155),
        new Gdp(year:2011, value:15.518),
        new Gdp(year:2010, value:14.964),
        new Gdp(year:2009, value:14.419),
        new Gdp(year:2008, value:14.719)
    })
});

// ...
class GdpData : DXNumericSeriesData {
    List<Gdp> gdpPoints;

    public GdpData(List<Gdp> points) {
        this.gdpPoints = points;
    }

    public override int DataCount { get => gdpPoints.Count; }
    public override double GetArgumentByIndex(int index) => gdpPoints[index].Year;
    public override double GetValueByIndex(int index) => gdpPoints[index].Value;
}

class Gdp {
    public int Year { get; private set; }
    public double Value { get; private set; }

    public Gdp(int year, double value) {
        this.Year = year;
        this.Value = value;
    }
}
The following table contains methods allowing you to obtain, add or remove series of the chart:
Symbol | Description |
|---|---|
Returns all series the Pie chart displays. | |
Adds the specified series to the Chart for display. | |
Removes the specified series from the Chart. | |
Removes a series with the specified index from the Pie chart. | |
The base class for all series the DXChart displays. |
Refer to the Series guide to learn more about chart series.
How to: Manage Chart Axes
The Chart Control’s Axes manage the Chart’s coordinate space. All series are measured and aggregated using axes. The following example demonstrates how to customize chart axes:
this.chart.AxisX = new DXDateTimeAxisX {
    MeasureUnit = DXDateTimeMeasureUnit.Year,
    GridAlignment = DXDateTimeMeasureUnit.Year,
    GridOffset = 0,
    GridSpacing = 1,
};

this.chart.AxisY = new DXNumericAxisY {
    GridAlignment = 1.0,
    AlwaysShowZeroLevel = false,
};
The table below contains classes and properties that configure chart axes:
Gets or sets the X-axis that calculates data points’ locations by arguments. | |
Gets or sets Y-axis that calculates data points’ locations by values. | |
The X-axis that manages qualitative arguments. | |
The X-axis that manages numeric arguments. | |
The X-axis that manages date-time arguments. | |
The Y-axis that manages numeric values. |
Refer to the Axes guide for more information about axes configuration.
How to: Configure the Chart Legend
The DXLegend identifies series and series points in a chart. The following example configures the legend to show it above the drawing area:
this.chart.Legend = new DXLegend {
    VerticalPosition = DXLegendVerticalPosition.TopOutside;
    HorizontalPosition = DXLegendHorizontalPosition.Center;
    Orientation = DXLegendOrientation.LeftToRight;
};
The table below contains symbols that configure the Chart’s legend:
DXChartBase.legend |Gets or sets the chart’s legend. |
DXLegend |A chart element that displays series and series points’ designations. |
Refer to the Legend guide for more information about legend configuration.
How to: Scroll and Zoom Chart
The Cartesian Chart allows end-users to navigate on the chart coordinate space using swipe and pinch gestures:
The following code example demonstrates how to enable zooming and scrolling through the X-axis and disable navigation through the Y axis, as the image above demonstrates:
this.chart.AxisXNavigationMode = DXAxisNavigationMode.ScrollingAndZooming;
this.chart.AxisYNavigationMode = DXAxisNavigationMode.None;
The code above uses the following methods:
Method | Description |
|---|---|
Gets or sets navigation actions available for the X-axis. | |
Gets or sets navigation actions available for the Y-axis. | |
Lists values that specify navigation actions available for an axis. |
How to: Change Chart Appearance
The Chart Control and all its children provide style objects to customize their appearance.
The following image demonstrates which chart parameters the style configures:
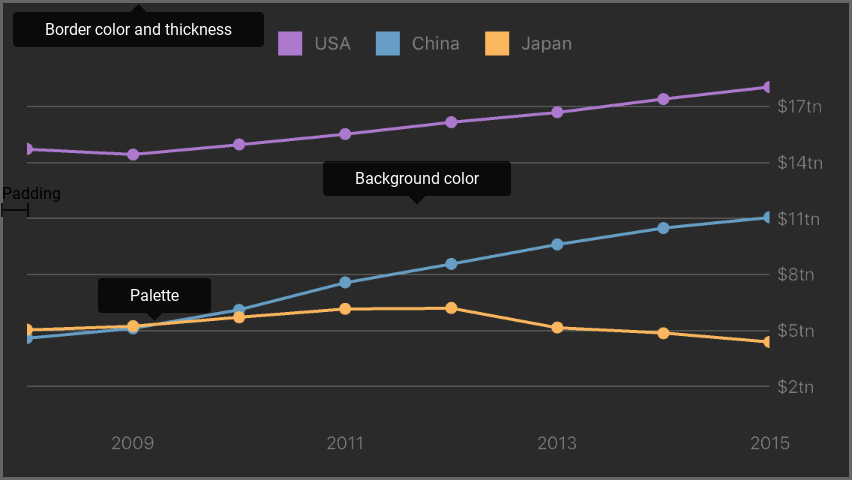
The following code snippet demonstrates how to obtain the image above:
// All sizes are in screen points.
this.chart.Style = new DXPieChartStyle {
    BorderColor = UIColor.FromWhiteAlpha(white: 0.4, alpha: 1.0),
    BorderThickness = 2,
    BackgroundColor = UIColor.FromWhiteAlpha(white: 0.16471, alpha: 1.0),
    Padding = new UIEdgeInsets(top: 16, left: 16, bottom: 16, right: 16),
    Palette = new DXPalette {
        Colors = new UIColor[] {
            UIColor.FromRGBA(red: 0.67843, green: 0.47451, blue: 0.80784, alpha: 1.0),
            UIColor.FromRGBA(red: 0.40392, green: 0.61961, blue: 0.77255, alpha: 1.0),
            UIColor.FromRGBA(red: 0.98824, green: 0.71373, blue: 0.36863, alpha: 1.0),
        }
    }
};
The following symbols allow you to configure chart style:
Gets or sets the chart appearance settings. | |
|
Note
A chart element’s style configures the element appearance. For example, use DXLegend.Style to configure the legend appearance.