DXLineSeries Class
Displays data as points to which a line connects.
Namespace: DevExpress.Xamarin.iOS.Charts
Assembly: DevExpress.Xamarin.iOS.Charts.dll
Declaration
public class DXLineSeries :
    DXSeries
Remarks
This series looks as follows:
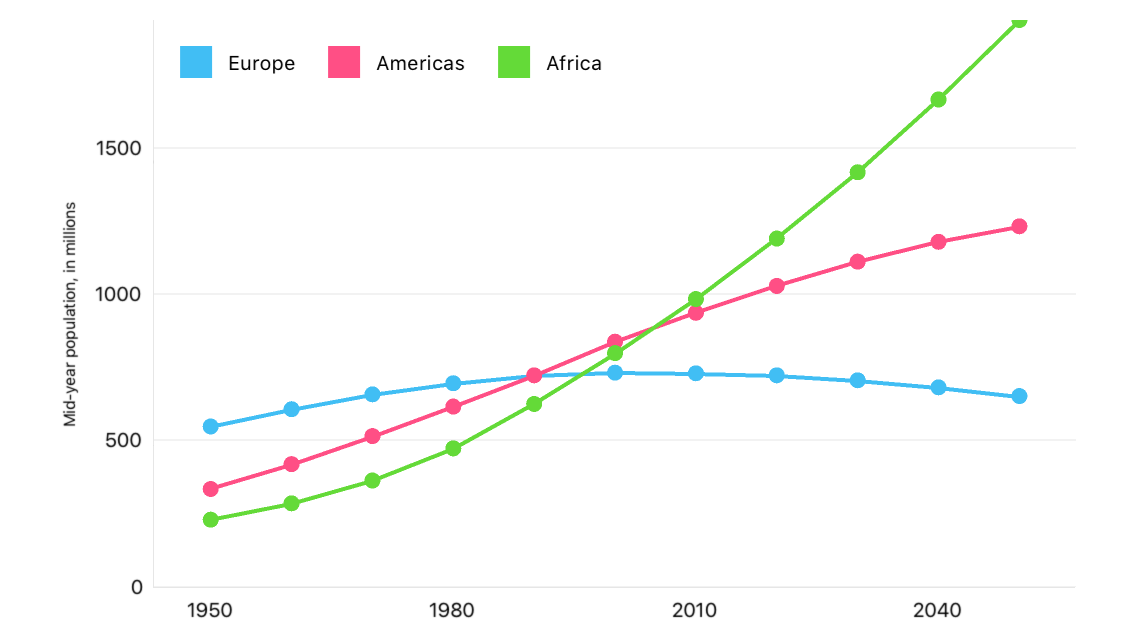
How to: Manage Series Data
This example demonstrates how to implement the adapter of a model object collection to a numeric series data:
// In the ViewDidLoad method.
List<NumericItem> europePopulationData = new List<NumericItem> {
    new NumericItem(1950, 546),
    new NumericItem(1960, 605),
    new NumericItem(1970, 656),
    new NumericItem(1980, 694),
    new NumericItem(1990, 721),
    new NumericItem(2000, 730),
    new NumericItem(2010, 728),
    new NumericItem(2020, 721),
    new NumericItem(2030, 704),
    new NumericItem(2040, 680),
    new NumericItem(2050, 650),
};

chart.AddSeries(new DXStepLineSeries {
    DisplayName = "Europe",
    Data = new NumericSeriesData(europePopulationData),
    MarkerHidden = false,
});
// ...

class YearPopulationListToNumericSeriesDataAdapter: DXNumericSeriesData {
    List<YearPopulation> data;
    public NumericSeriesData(List<YearPopulation> data) {
        this.data = data;
    }
    public override int DataCount => (data != null) ? data.Count : 0;
    public override double GetArgumentByIndex(int index) => data[index].Year;
    public override double GetValueByIndex(int index) => data[index].Value;
}

class YearPopulation {
    public double Year { get; }
    public double Population { get; }

    public NumericItem(double argument, double value) {
        Year = year;
        Value = value;
    }
}
The code above uses the classes and members below:
Symbol | Description |
|---|---|
| Displays data as points to which a line connects. |
Gets or sets data the series display on the Chart. | |
|
This series should use one of the following classes as the Data property value to load data to display:
Data interface | Description |
|---|---|
| |
The series ignores values the DXWeightedQualitativeSeriesData.GetWeightByIndex() method returns. | |
| |
The series ignores values the DXWeightedNumericSeriesData.GetWeightByIndex() method returns. | |
| |
The series ignores values the DXWeightedDateTimeSeriesData.GetWeightByIndex() method returns. |
Important
The data class the series uses should be compatible with the type of object assigned to the DXChart.AxisX property; otherwise, the Chart does not display the series. The Chart view creates an axis that is compatible with the first series’ data class if you do not specify its AxisX property value.
How to: Customize Series Point Labels
Labels accompany series points and show series points’ values as text on a chart:
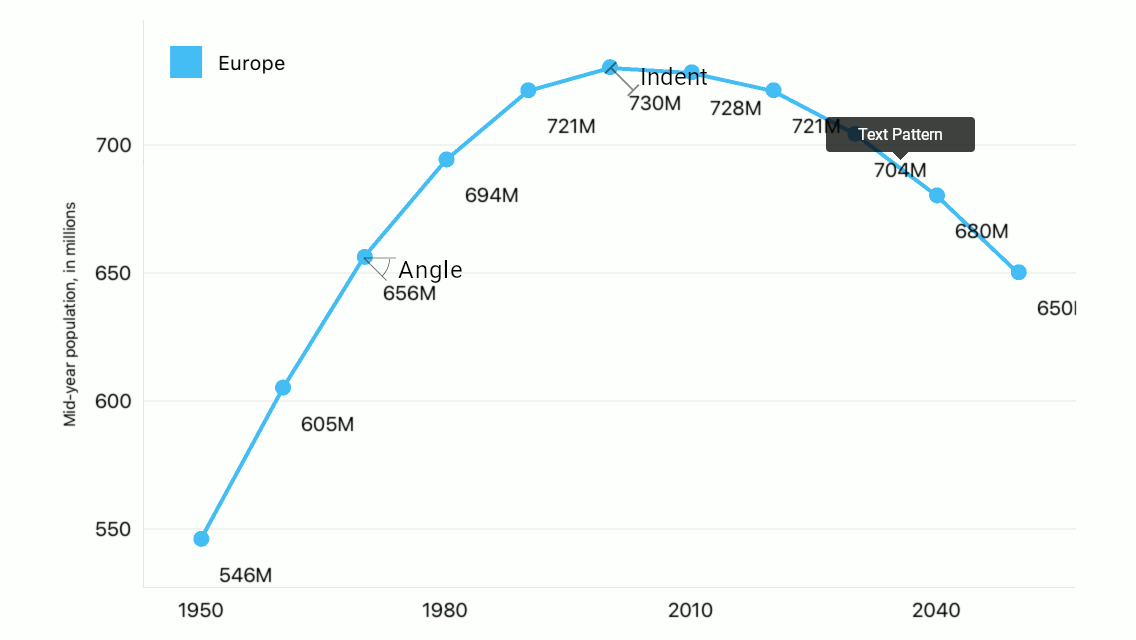
The following code specifies the Line series’s label settings:
Label = new DXMarkerSeriesLabel {
    Indent = 15,
    Angle = 45,
    TextPattern = "{V$##}M"
};
The example above utilizes the classes and properties below:
Symbol | Description |
|---|---|
| |
| |
| |
| |
|
The text pattern can utilize the following value placeholders to generate the labels’ text:
| Placeholder | Description |
|---|---|
| {S} | Displays a series name. |
| {A} | Displays a series point argument. |
| {V} | Displays a series point value. |
Note
These values can be formatted using default format strings after the $ sign.
For example, in the {V$#.##} string, V is a placeholder, $ is a format string separator, and #.## is a format string.
How to: Specify Text the Legend Displays
The legend displays legend items for each series or series point the chart displays. A legend item includes a color marker and text that explains data the series/series point shows:
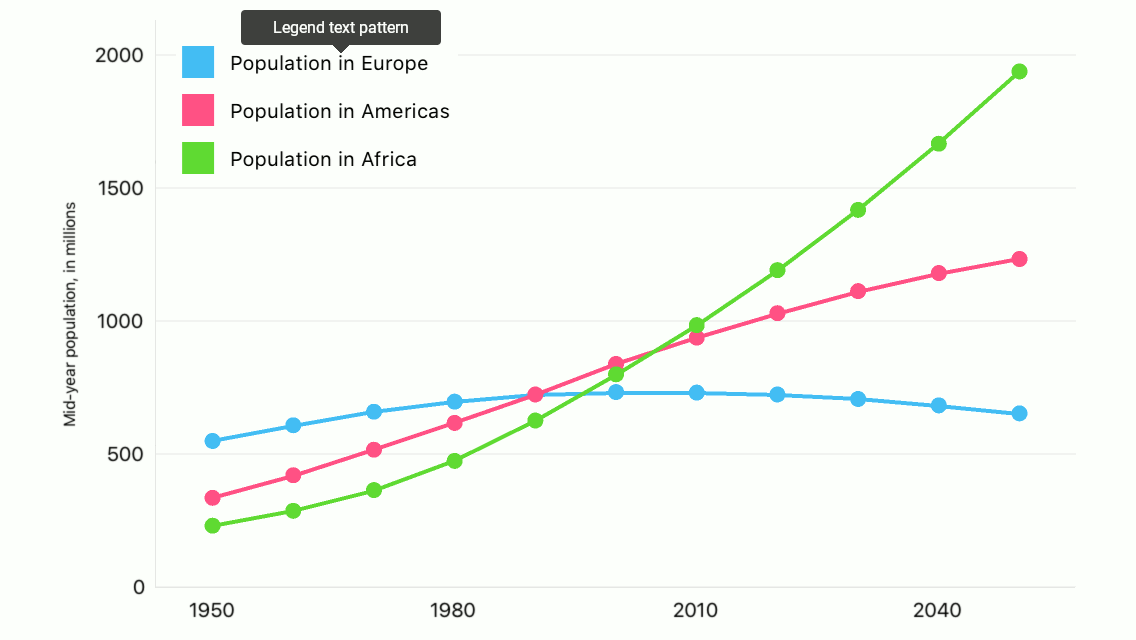
The following code manages text the legend displays for the series:
series.LegendTextPattern = "Population in {S}";
The LegendTextPattern property configures the text items contain. The default legend text is:
- for a series - its DisplayName.
- for a series point - its value converted to a string.
Note
The legend displays items for series points when the ColorEach property is set to true.
The text pattern can utilize the following value placeholders to generate legend items’ text:
| Placeholder | Description |
|---|---|
| {S} | Displays a series name. |
| {A} | Displays a series point argument. |
| {V} | Displays a series point value. |
Note
These values can be formatted using default format strings after the $ sign.
For example, in the {V$#.##} string, V is a placeholder, $ is a format string separator, and #.## is a format string.
How to: Manage the Series Interaction with the Hint
The chart Hint interacts with series to request values to display, to ask a series what axis lines the Crosshair should display, etc:

The following code specifies how the hint displays the series:
series.HintOptions = new DXSeriesCrosshairOptions {
    PointTextPattern = "{S}: {V$##}M",
    ShowInLabel = true,
    AxisLineHidden = false,
    AxisLabelHidden = false,
};
The series can utilize the classes and properties below to configure how the hint displays it:
Symbol | Description |
|---|---|
| |
| |
| |
| |
| |
|
Note
Properties the DXSeriesCrosshairOptions class introduces do not affect the hint when the hint’s Behavior is set to DXTooltipHintBehavior. At the same time, all properties the class inherits from its parent influence the hint.
The point text pattern and series text pattern can utilize the following value placeholders to generate hint items’ text:
| Placeholder | Description |
|---|---|
| {S} | Displays a series name. |
| {A} | Displays a series point argument. |
| {V} | Displays a series point value. |
Note
These values can be formatted using default format strings after the $ sign.
For example, in the {V$#.##} string, V is a placeholder, $ is a format string separator, and #.## is a format string.
How to: Configure Series Appearance
The series style provides the following parameters that specify a series’ appearance:
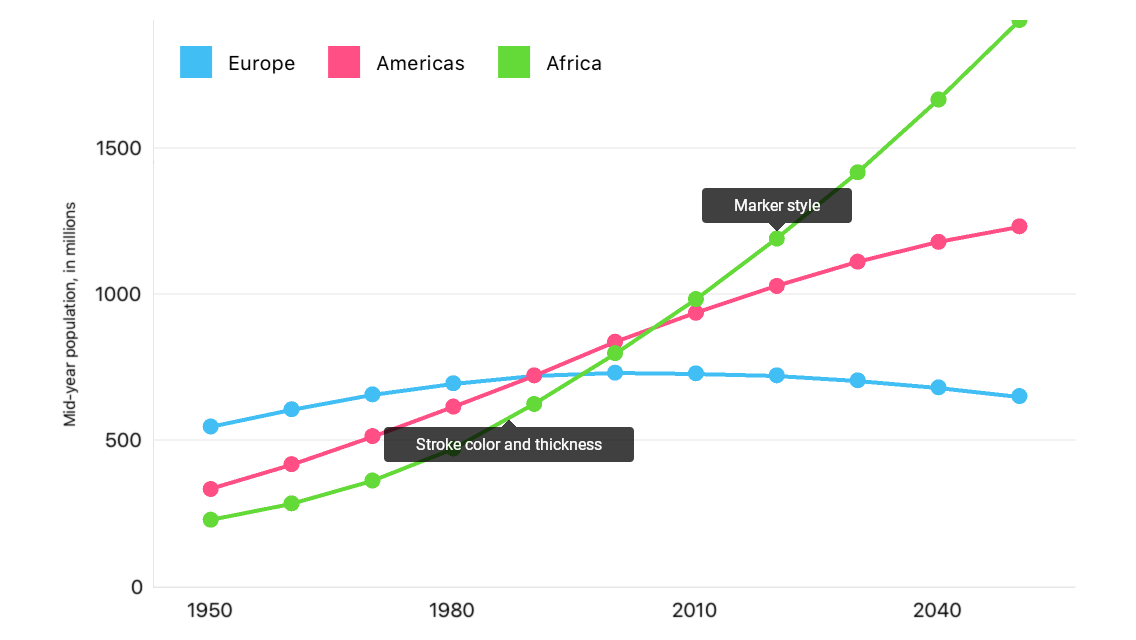
The code below customizes the Line series’s appearance:
areaSeries.Style = new DXLineSeriesStyle {
    Stroke = UIColor.FromRGB(0.898f, 0.224f, 0.208f),
    StrokeThickness = 5,
    MarkerSize = 25,
    MarkerStyle = new DXMarkerStyle {
       Fill = UIColor.FromRGB(0.898f, 0.224f, 0.208f),
       Stroke = UIColor.FromWhiteAlpha(0.000f, 0.250f),
       StrokeThickness = 5
    }
};
This code utilizes the following classes and members:
Symbol | Description |
|---|---|
| |
| |
| |
| |
| |
|