DXNumericAxisY Class
The Y-axis that manages numeric values.
Namespace: DevExpress.Xamarin.iOS.Charts
Assembly: DevExpress.Xamarin.iOS.Charts.dll
Declaration
public class DXNumericAxisY :
    DXAxisBase
Related API Members
The following members return DXNumericAxisY objects:
Remarks
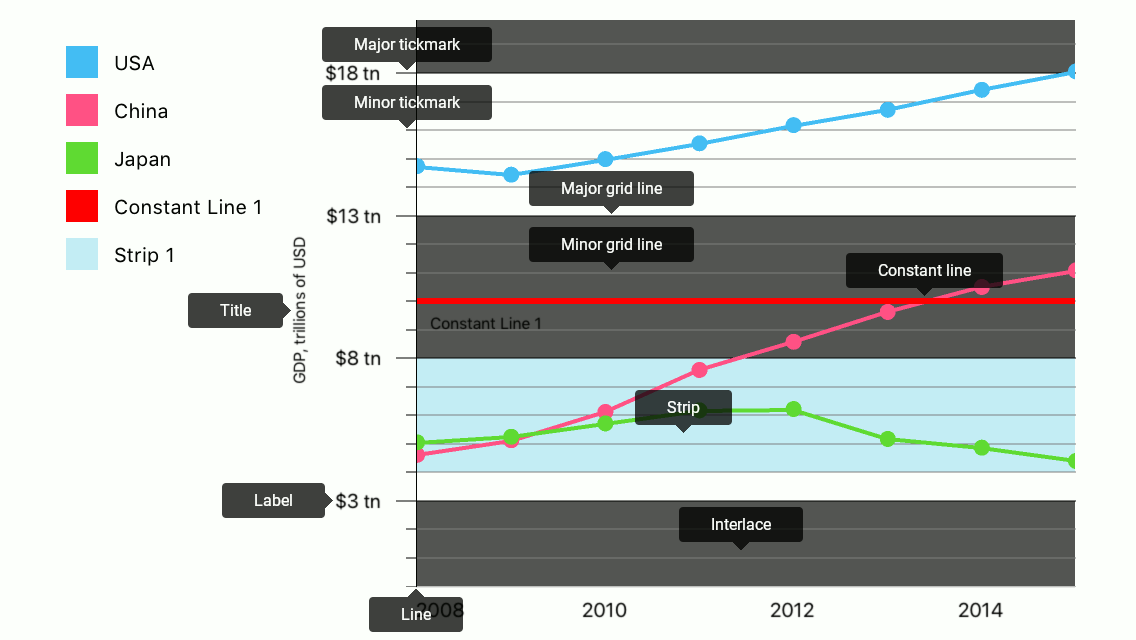
The numeric Y-axis contains the following elements:
How to: Specify chart axes
The chart creates default axes taking into account the first series’ Data type. Specify the chart’s AxisX property to customize the axis the chart uses:
self.chart.AxisY = new DXNumericAxisY {
  GridOffset = 3,
  GridSpacing = 6,
  AlwaysShowZeroLevel = false
};
How to: change axis range
The chart automatically calculates the axes’ ranges based on chart series values. A range object defines a full and visual range. The Full Range specifies the overall range of data displayed on the Chart and the Visual Range defines the range of the current chart viewport:
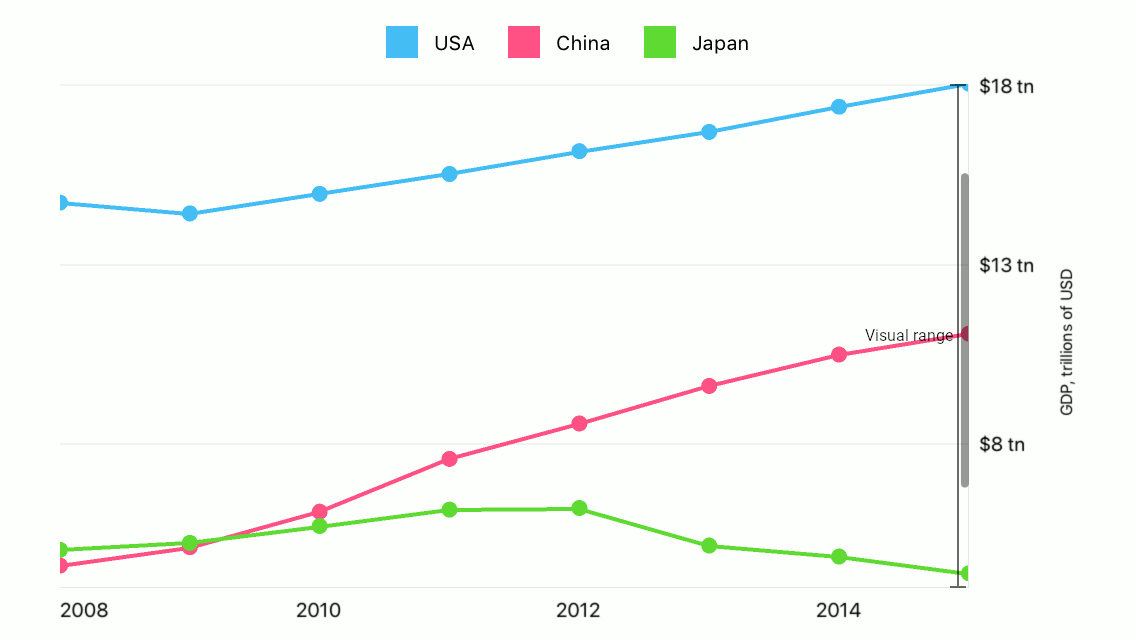
The following code specifies a custom range:
axisY.Range = new DXNumericRange {
    Min = 0,
    Max = 20,
    VisualMin = 4,
    VisualMax = 18
};
The following table contains the main symbols allowing you to specify ranges. Note that each axis type has a range type:
Symbol | Description |
|---|---|
| |
|
How to: Customize axis scale parameters
The following image shows the Numeric Axis‘s scale parameters:
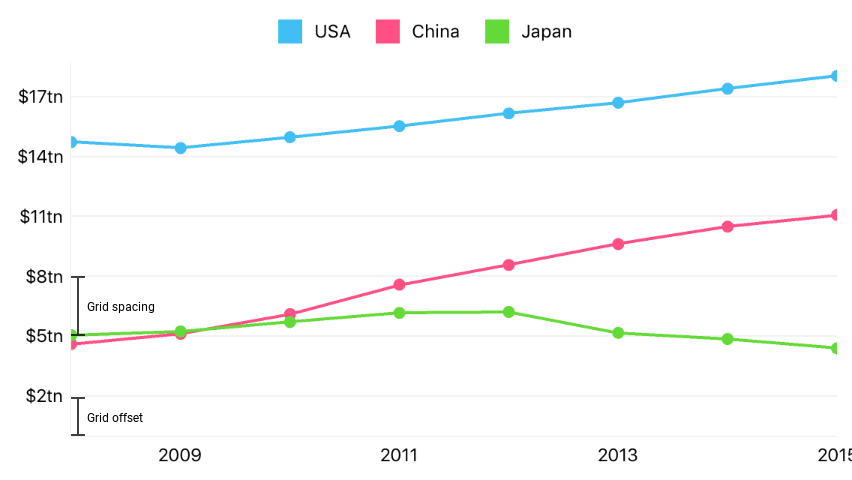
The code below configures the scale as in the image above:
this.chart.AxisY = new DXNumericAxisY {
    // Grid Offset - distance between the first major tickmark/gridline and 0.
    GridOffset = 2,
    // Grid Alignment - distance between two major tickmarks and gridlines.
    GridAlignment = 3
};
The following table lists all symbols that specify a numeric axis’s scale parameters:
Symbol | Description |
|---|---|
| |
|
How to: Manage an axis’ labels
Axis Labels labels show textual representations of axis values at major tick marks:
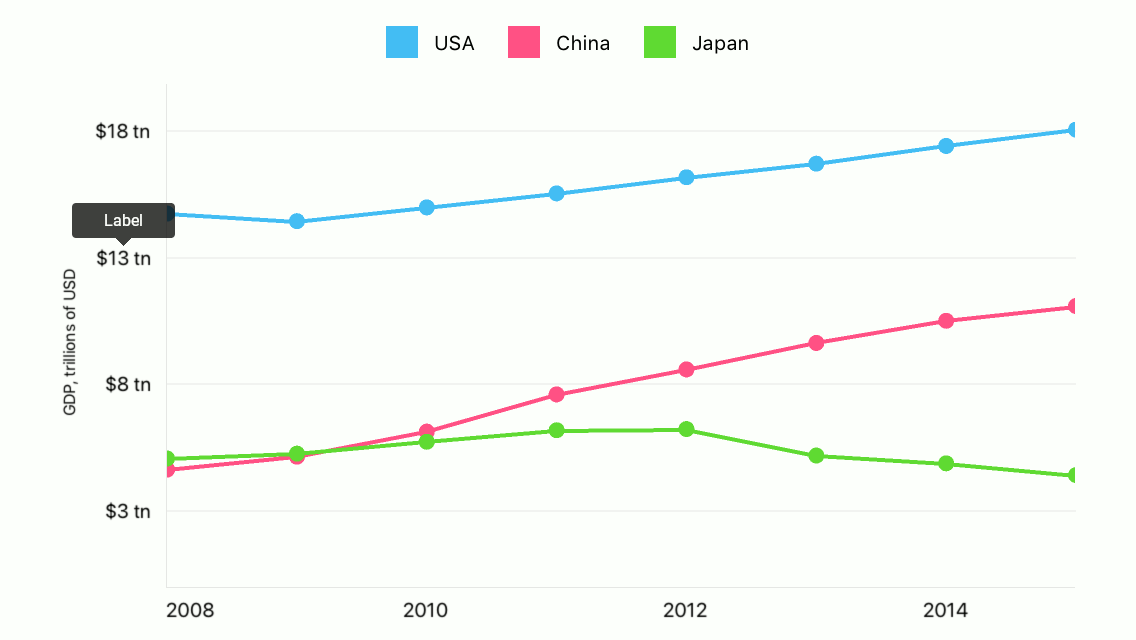
The axis label converts an axis value using the format string or a text provider object. The following code uses the format string to customize label content:
axisY.Label = new DXAxisLabel {
    Format = "$00 tn",
};
| |
| |
| |
| |
|
How to: Customize the axis title
The Axis Title allows you to display text that explains the axis values.
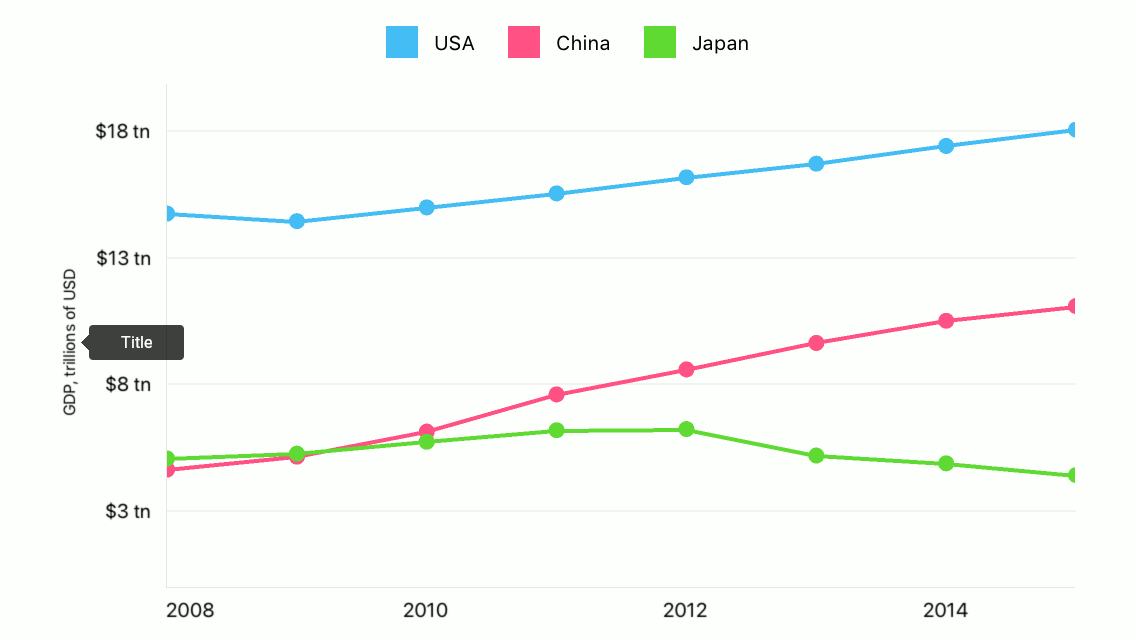
The following code demonstrates how to specify an axis’ title:
axisY.Title = new DXAxisTitle() {
    Text = "GDP, trillions of USD",
    Alignment = DXAxisTitleAlignment.Far
};
The code above uses the following classes and members:
| |
|
How to: Add a constant line
Constant lines provide the capability to highlight a value on an axis:
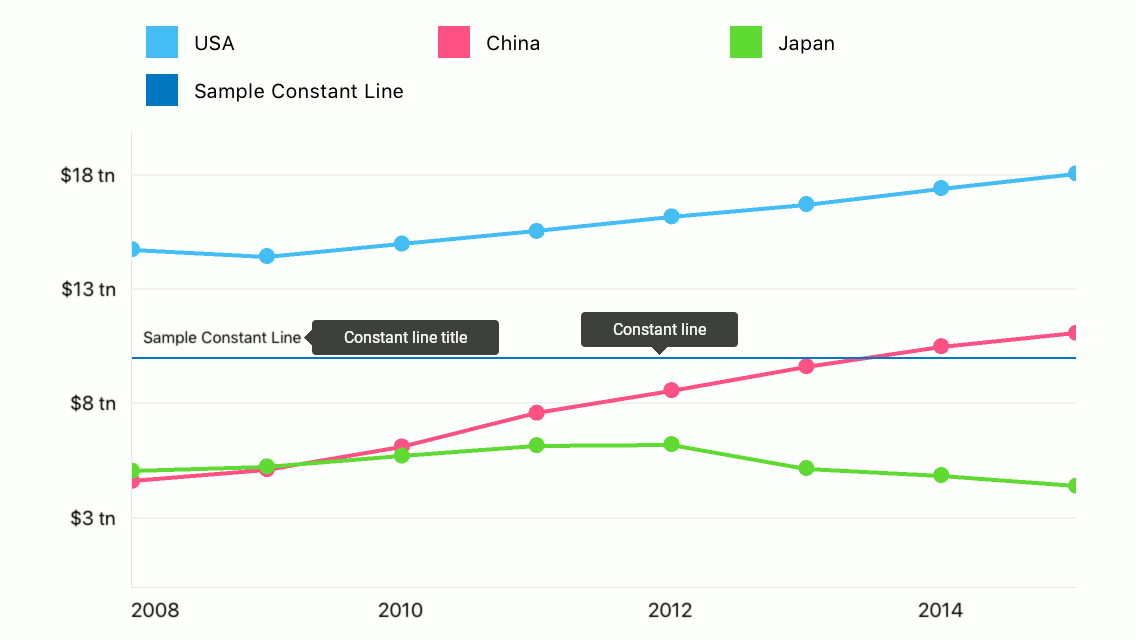
The following example demonstrates how to configure a constant line:
axisY.AddConstantLine(new DXNumericConstantLine(10) {
    Title = new DXConstantLineTitle {
        Text = "Sample Constant Line",
    },
    ShowTitleBelowLine = true,
    LegendText = "Sample Constant Line",
    ShowInLegend = true,
});
The following classes and members allow you to configure a constant line:
| |
| |
| |
|
How to: Add a strip
Strips provide the capability to highlight axis ranges:
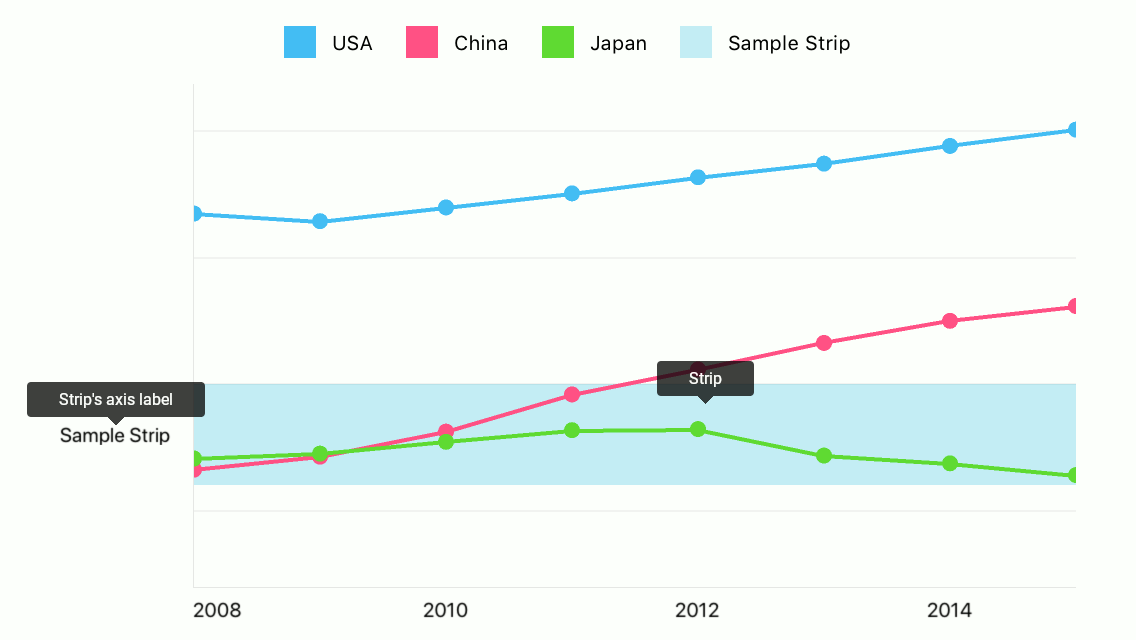
The following example demonstrates how to configure a strip:
axisY.AddStrip(new DXNumericStrip() {
    MaxLimit = 5,
    MinLimitEnabled = false,
    Label = new DXStripAxisLabel {
        Text = "Sample Strip",
    },
    AxisLabelHidden = false,
    LegendText = "Sample Strip",
    LegendTextHidden = false
};
The following classes and members allow you to configure a strip:
| |
| |
| |
|
How to: Configure appearance of axis elements
The following image shows axis elements whose appearance the axis style manages:
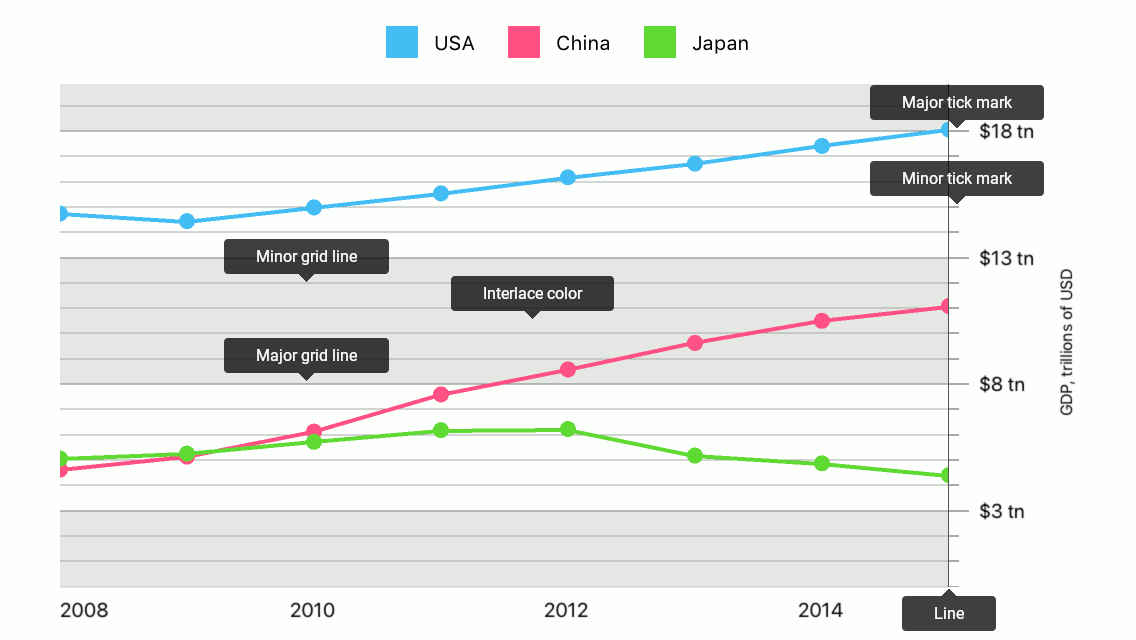
You should configure all other elements’ appearance using an element Style property.
The code below configures the axis as the image above displays:
// All sizes are in screen points.
axisY.style = new DXAxisStyle {
    LineHidden = false,
    MajorGridlinesHidden = false,
    MinorGridlinesHidden = false,
    MajorTickmarksHidden = false,
    MinorTickmarksHidden = false,

    LineColor = UIColor.darkGray,
    MajorGridlinesColor = UIColor.gray,
    MinorGridlinesColor = UIColor.lightGray
};

axisY.Label.Style = new DXAxisLabelStyle {
    TextStyle = new DXTextStyle {
        FontSize = 10
    }
};
The following table list classes and properties that specify how an axis and axis elements look:
Symbols | Description |
|---|---|
| |
| |
| |
| |
| |
| |
| |
|