Axes
- 7 minutes to read
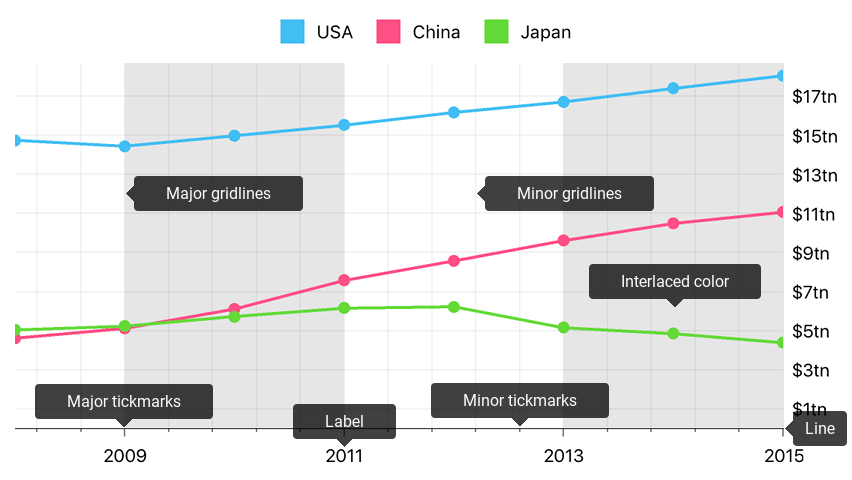
The Cartesian chart uses axes to manage its coordinate space. All series are measured and aggregated using axes. Axes also contain elements that improve a chart’s readability. The following image highlights axes and their elements:
Note
This guide does not contain information about axis elements. Refer to the Axes: Elements guide to learn more about axis elements.
How to: Specify chart axes
Axes are created based on the first series’ data type by default. You can specify the type of axis if the default appearance does not meet your requirements.
The following examples demonstrate how to specify chart axes:
DXDateTimeAxisX *axisX = [[DateTimeAxisX alloc] init];
axisX.measureUnit = DXDateTimeMeasureUnitHour;
self.chart.axisX = axisX;
Note
The X-axis and series data type should be compatible. For example, if the series data conforms the DXNumericSeriesData protocol, use the DXNumericAxisX axis; otherwise, the series data is not visualized. Refer to the Data Providing guide to learn more about data interfaces and axes compatibility.
The following table contains all symbols necessary for axis configuration:
| Symbol | Description |
|---|---|
| DXChart.axisX | Gets or sets the chart’s X-axis (arguments axis). |
| DXChart.axisY | Gets or sets the chart’s Y-axis (values axis). |
| DXQualitativeAxisX | The qualitative arguments axis. |
| DXNumericAxisX | The numeric arguments axis. |
| DXDateTimeAxisX | The date-time arguments axis. |
| DXNumericAxisY | The numeric values axis. |
How to: change axis range
The chart automatically calculates the axes’ ranges based on chart series values. Use the following code to specify a custom range:
DXDateTimeRange *range = [[DXDateTimeRange alloc] init];
range.min = [ViewController dateFromYear:2008];
range.max = [ViewController dateFromYear:2015];
range.visualMin = [ViewController dateFromYear:2009];
range.visualMax = [ViewController dateFromYear:2013];
axisX.range = range;
The image below demonstrates the result of the code.
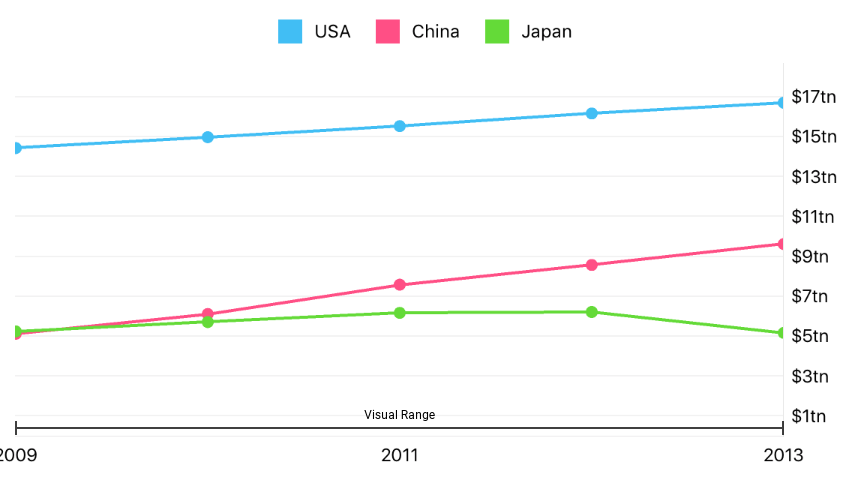
Note that a range consists of a full and visual range. The full range specifies the overall range of data displayed on the Chart while the visual range defines the range of the current chart viewport.
The following table contains the main symbols allowing you to specify ranges. Note that each axis type has a range type.
| Symbol | Description |
|---|---|
| DXQualitativeAxisX.range | Gets or sets the qualitative arguments axis’s range parameters. |
| DXNumericAxisX.range | Gets or sets the numeric arguments axis’s range parameters. |
| DXDateTimeAxisX.range | Gets or sets the date-time arguments axis’s range parameters. |
| DXNumericAxisY.range | Gets or sets the values axis’s range parameters. |
| DXQualitativeRange | The qualitative axis range. |
| DXNumericRange | The numeric axis range. |
| DXDateTimeRange | The date-time axis range. |
How to: Customize axis scale parameters
The scale parameters available for customization depend on the axis type. The following list groups parameters by axis types:
Qualitative Axis does not have a scale parameter.
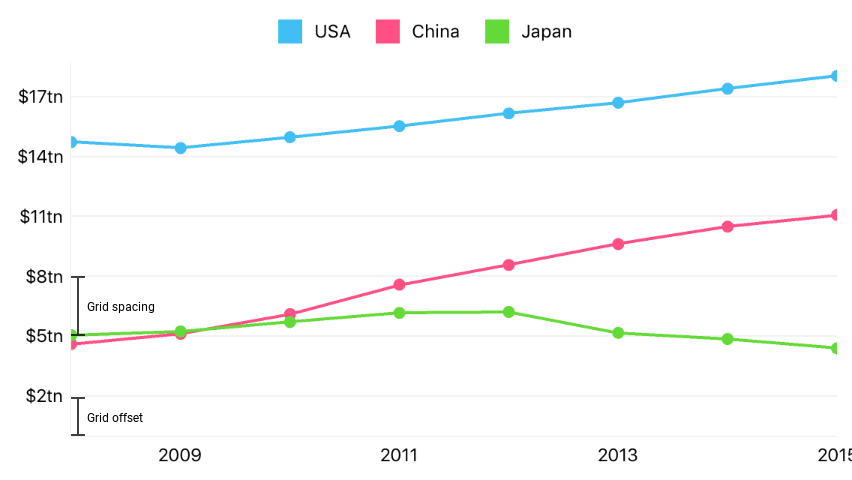
Numeric Axis has parameters represented in the image below.
The following code contains an example of parameter customization:
DXNumericAxisY *axisY = [[DXNumericAxisY alloc] init]; // Grid Offset - offset of the first major tickmark and gridline from 0. axisY.gridOffset = 2; // Grid Alignment - distance between two major tickmarks and gridlines. axisY.gridAlignment = 3; self.chart.axisY = yAxis;The table lists all the symbols allowing you to specify numeric axis scale parameters.
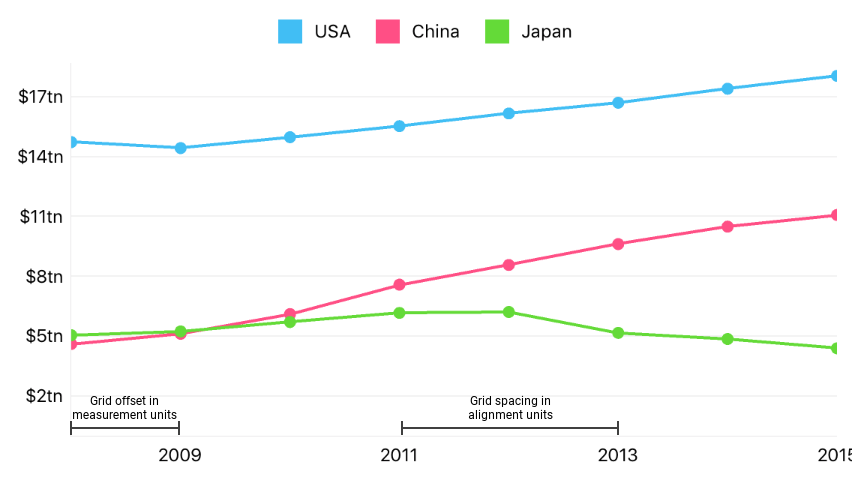
Symbol Description NumericAxisX.gridOffset Gets or sets the first major tickmark’s and gridline’s offset from the range’s minimum value on the numeric arguments axis. NumericAxisX.gridAlignment Gets or sets the major tickmarks’s and gridlines’ alignment on the numeric arguments axis. NumericAxisY.gridOffset Gets or sets the first major tickmark’s and gridline’s offset from the range’s minimum value on the numeric values axis. NumericAxisY.gridAlignment Gets or sets the major tickmarks and gridlines’ alignment on the numeric values axis. Date-Time Axis contains scale parameters shown in the following image.
The code below demonstrates how to configure these parameters.
DXDateTimeAxisX *axisX = [[DXDateTimeAxisX alloc] init]; // If series data provides more detailed data than the measurement unit, for example, by hours, axisX.measureUnit = DXDateTimeMeasureUnitDay; // data is aggregated using a function specified by this aggregation type. axisX.aggregationType = DXAggregationTypeAvg; // Unit used to align the grid may be different from the measurement unit. // It should be less detailed. axisX.gridAlignment = DXDateTimeMeasureUnitWeek; // The Offset and Spacing are in alignment units. // Grid Offset - specifies how many units are skipped before // the first major tickmark and gridline. axisX.gridOffset = 1; // Grid Spacing - distance between two major tickmarks and gridlines, in units. axisX.gridSpacing = 2; self.chart.axisX = axisX;The table lists all symbols allowing you to specify scale parameters of a numeric axis.
Symbol Description measureUnit Gets or sets the date-time arguments axis’s measurement unit. aggregationType Gets or sets the date-time arguments axis’s aggregation function’s type. gridAlignment Gets or sets the date-time arguments axis’s measurement unit by which grid is aligned. gridOffset Gets or sets the first major tickmark’s and gridline’s initial offset from the range’s minimum value on the date-time arguments axis. gridSpacing Gets or sets the distance between two major tickmarks and gridlines on the date-time arguments axis.
How to: Configure appearance of axis elements
The following image represents axis elements whose appearance can be changed:
The following code demonstrates how to modify their appearance:
DXAxisStyle *axisStyle = [[DXAxisStyle alloc] init];
DXAxisLabelStyle *labelStyle = [[DXAxisLabelStyle alloc] init];
DXTextStyle *labelTextStyle = [[DXTextStyle alloc] init];

axisStyle.lineHidden = NO;
axisStyle.majorGridlinesHidden = NO;
axisStyle.minorGridlinesHidden = NO;
axisStyle.majorTickmarksHidden = NO;
axisStyle.minorTickmarksHidden = NO;

axisStyle.lineColor = UIColor.darkGrayColor;
axisStyle.majorGridlinesColor = UIColor.grayColor;
axisStyle.minorGridlinesColor = UIColor.lightGrayColor;

axisY.style = axisStyle;
axisY.label.style = labelStyle;
labelStyle.textStyle = labelTextStyle;
labelTextStyle.fontSize = 10;
| Methods | Description |
|---|---|
| DXAxisBase.style | Gets or sets axis style parameters. |
| DXAxisStyle | The axis’s appearance settings storage. |
| DXAxisLabelBase.style | Gets or sets the axis labels’ appearance settings. |
| DXAxisLabelStyle | The axis labels’ appearance settings storage. |