DXQualitativeAxisX Class
The X-axis that manages qualitative arguments.
Namespace: DevExpress.Xamarin.iOS.Charts
Assembly: DevExpress.Xamarin.iOS.Charts.dll
Declaration
public class DXQualitativeAxisX :
    DXAxisX
Remarks
Use this axis to display series that use the following data protocols:
The qualitative X-axis contains the following elements:
How to: Specify chart axes
The chart creates default axes taking into account the first series’ Data type. Specify the chart’s AxisX property to customize the axis the chart uses:
self.chart.AxisX = new DXQualitativeAxisX();
How to: change axis range
The chart automatically calculates the axes’ ranges based on chart series values. A range object defines a full and visual range. The Full Range specifies the overall range of data displayed on the Chart and the Visual Range defines the range of the current chart viewport:
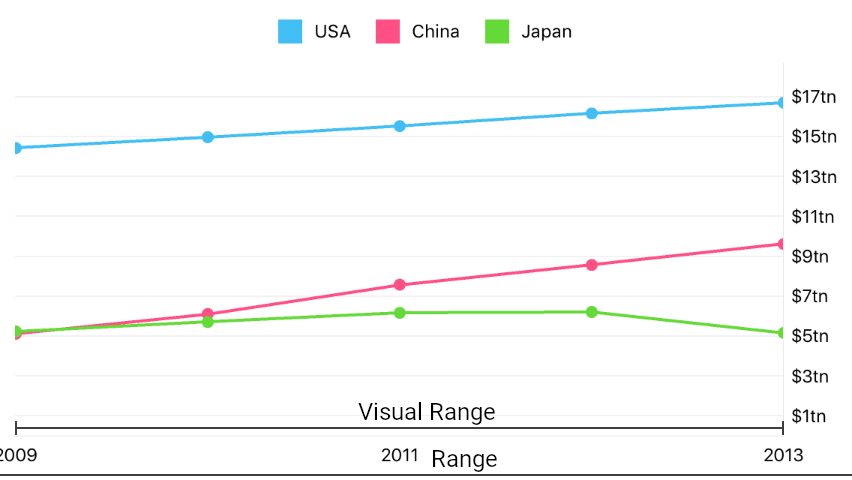
The following code specifies a custom range:
axisX.Range = new DXQualitativeRange {
    Min = "2008",
    Max = "2015",
    VisualMin = "2009",
    VisualMax = "2013"
};
The following table contains the main symbols allowing you to specify ranges. Note that each axis type has a range type:
Symbol | Description |
|---|---|
| |
|
How to: Manage an axis’ labels
Axis Labels labels show axis values at major tick marks:
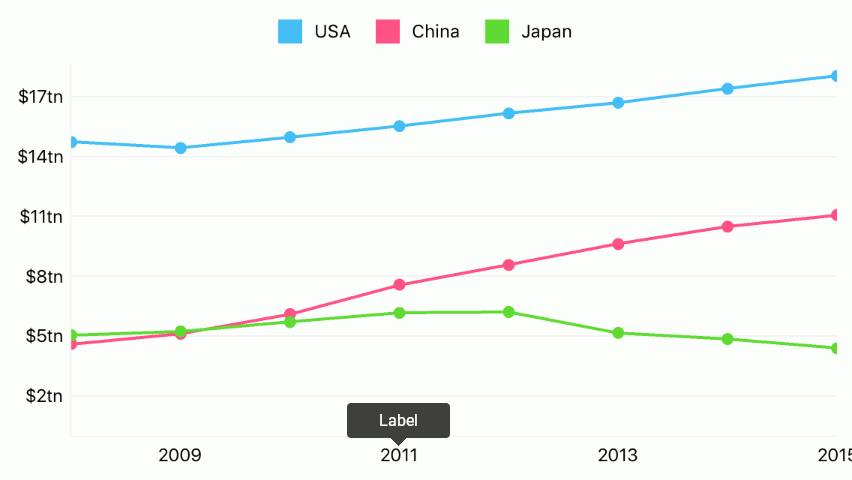
An axis’s text provider customizes axis label content and the DXAxisLabel object configures label appearance and position.
Important
The DXAxisLabel.Format property does not affect label text when the DXAxisLabel object manages the DXQualitativeAxisX‘s labels.
The following code uses the formatter to customize label content:
axisX.Label = new DXAxisLabel {
    Position = DXAxisLabelPosition.Inside
};
axisX.LabelTextFormatter = new CustomLabelTextFormatter();

// Some code is skipped.
public class CustomLabelTextFormatter : DXQualitativeAxisLabelTextFormatter {
    public override string Format(string value) => $"{value} year";
}
| |
| |
| |
|
How to: Customize the axis title
The Axis Title allows you to display text that explains the axis values.
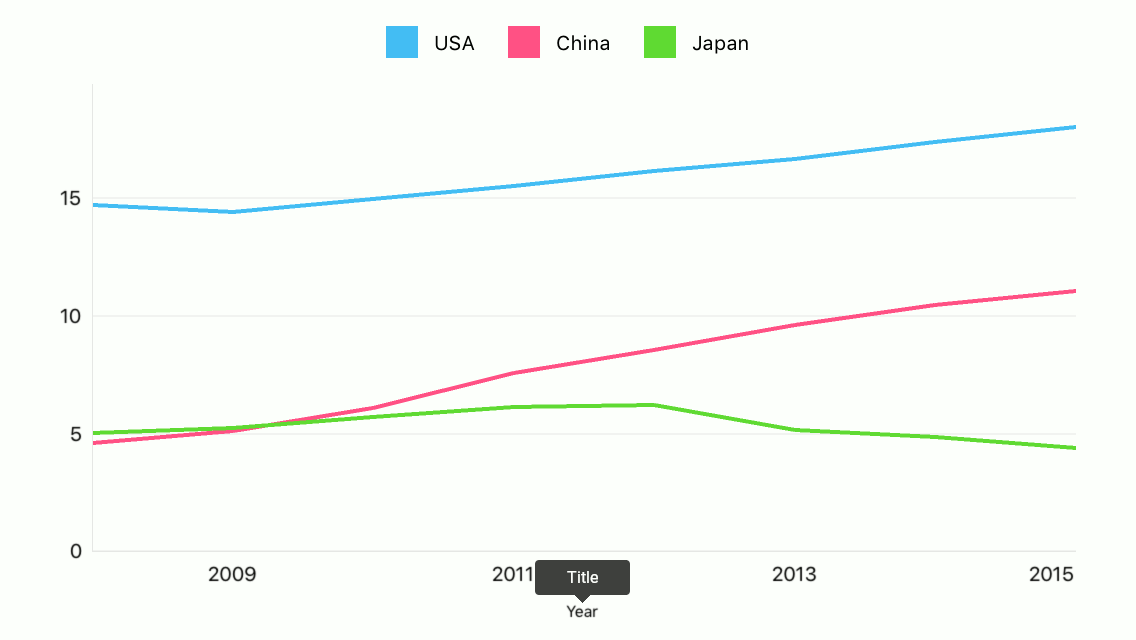
The following code demonstrates how to specify an axis’ title:
axisX.Title = new DXAxisTitle() {
    Text = "Year",
    Alignment = DXAxisTitleAlignment.Far
};
The code above uses the following classes and members:
| |
|
How to: Add a constant line
Constant lines provide the capability to highlight a value on an axis:
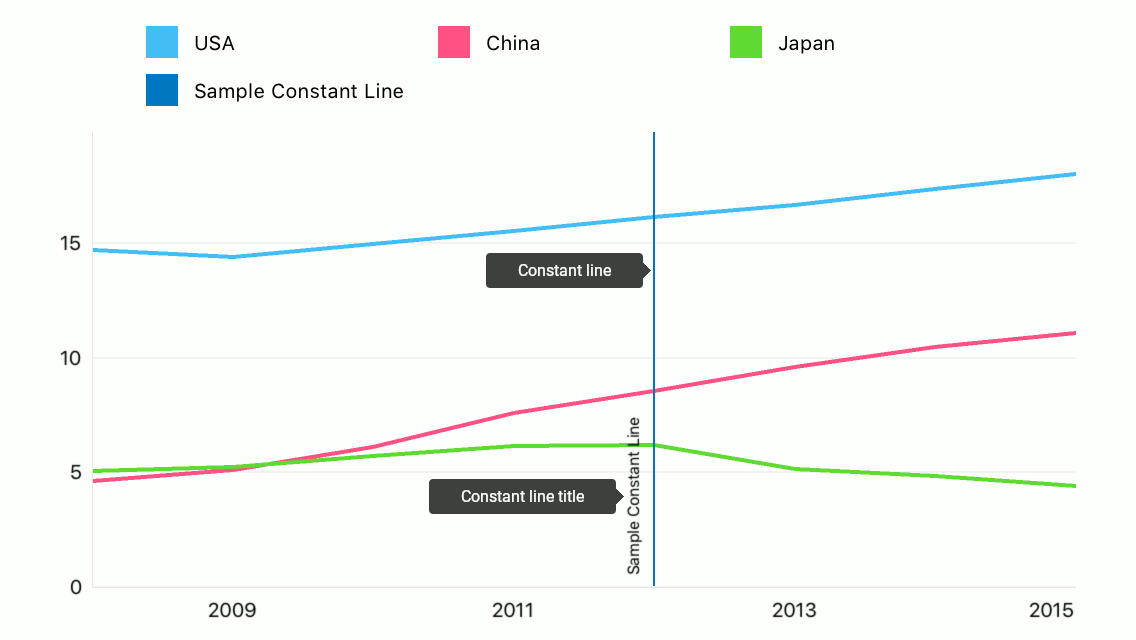
The following example demonstrates how to configure a constant line:
axisY.AddConstantLine(new DXQualitativeConstantLine("2012") {
    Title = new DXConstantLineTitle {
        Text = "Sample Constant Line",
    },
    ShowTitleBelowLine = true,
    LegendText = "Sample Constant Line",
    ShowInLegend = true,
});
The following classes and members allow you to configure a constant line:
| |
DXQualitativeAxisX.AddConstantLine(DXQualitativeConstantLine) |
|
DXQualitativeAxisX.RemoveConstantLine(DXQualitativeConstantLine) |
|
|
How to: Add a strip
Strips provide the capability to highlight axis ranges:
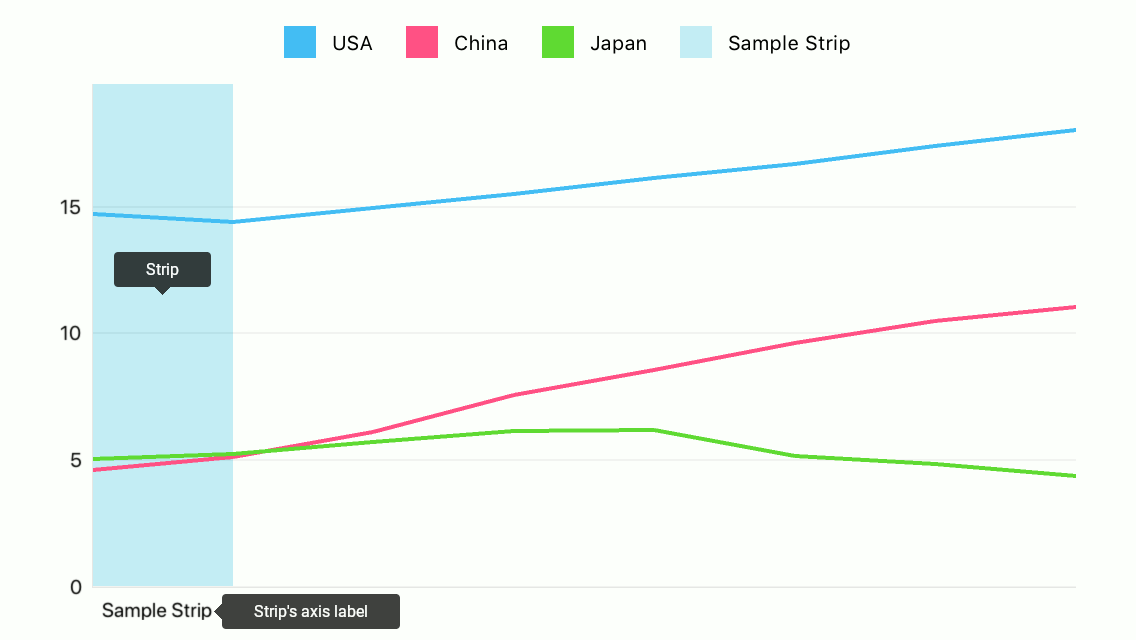
The following example demonstrates how to configure a strip:
axisY.AddStrip(new DXQualitativeStrip() {
    MaxLimit = "2009",
    MinLimitEnabled = false,
    Label = new DXStripAxisLabel {
        Text = "Sample Strip",
    },
    AxisLabelHidden = false,
    LegendText = "Sample Strip",
    LegendTextHidden = false
});
The following classes and members allow you to configure a strip:
| |
| |
| |
|
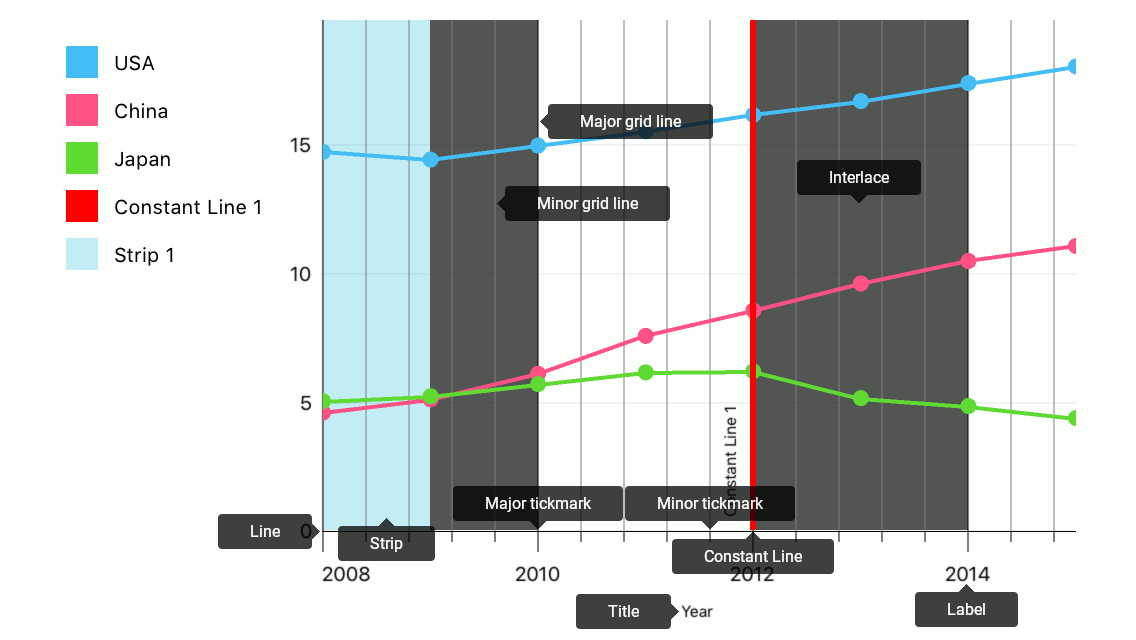
How to: Configure appearance of axis elements
The following image shows axis elements whose appearance the axis style manages:
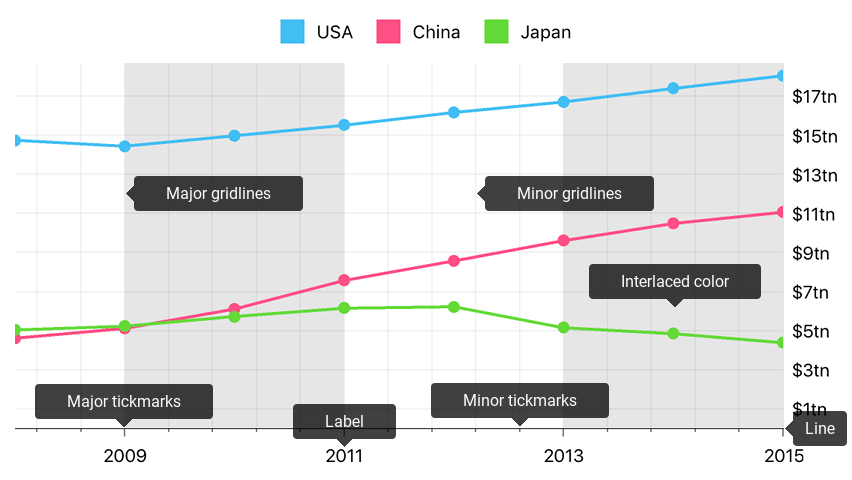
You should configure all other elements’ appearance using an element Style property.
The code below configures the axis as the image above displays:
// All sizes are in screen points.
axisX.style = new DXAxisStyle {
    LineHidden = false,
    MajorGridlinesHidden = false,
    MinorGridlinesHidden = false,
    MajorTickmarksHidden = false,
    MinorTickmarksHidden = false,

    LineColor = UIColor.darkGray,
    MajorGridlinesColor = UIColor.gray,
    MinorGridlinesColor = UIColor.lightGray
};

axisX.Label.Style = new DXAxisLabelStyle {
    TextStyle = new DXTextStyle {
        FontSize = 10
    }
};
The following table lists classes and properties that specify how an axis and axis elements look:
Symbols | Description |
|---|---|
| |
| |
| |
| |
| |
| |
| |
|