DXStockSeries Class
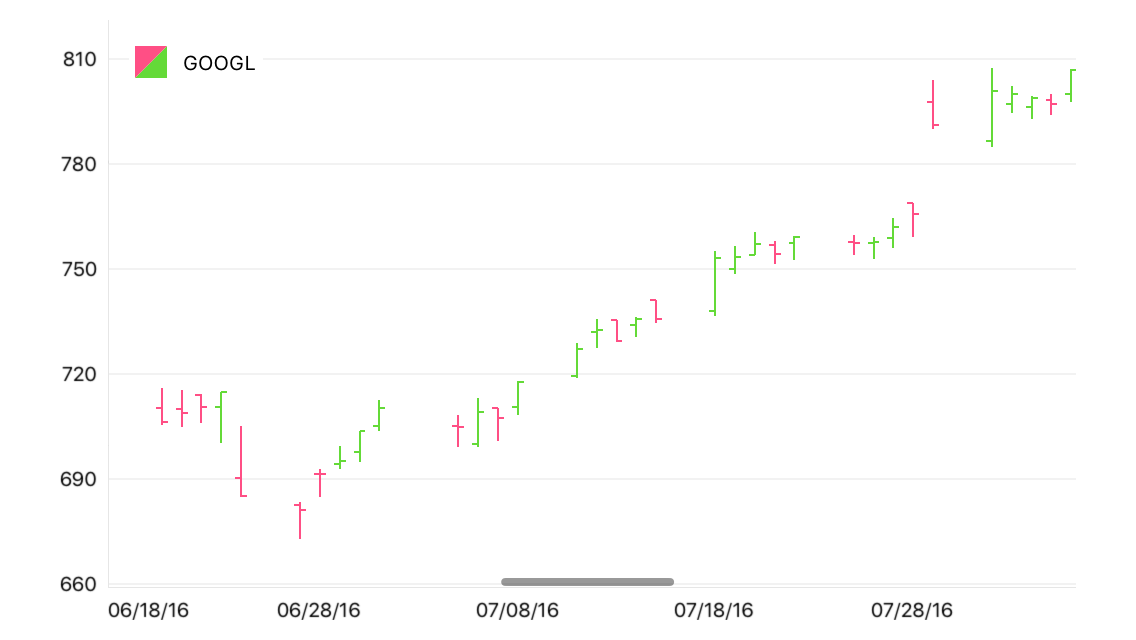
Displays data as a set of vertical lines with horizontal dashes. Each vertical line represents the price range (high and low price values) for a given data point. The left horizontal dash displays the opening price and the right dash shows the closing price.
Namespace: DevExpress.Xamarin.iOS.Charts
Assembly: DevExpress.Xamarin.iOS.Charts.dll
Declaration
public class DXStockSeries :
    DXSeries
Remarks
This series looks as follows:
How to: Manage Series Data
This example demonstrates how to implement the adapter of a model object collection to financial series data:
// In the ViewDidLoad method.
IReadOnlyList<StockItem> googleStocks = new StockRepository().GetByCompany("GOOGL");

this.chart.AddSeries(
    new DXStockSeries {
        DisplayName = "GOOGL",
        Data = new StockItemListToFinancialSeriesDataAdapter(googleStocks)
    }
);
// ...

public class StockItemListToFinancialSeriesDataAdapter : DXFinancialSeriesData {
    readonly IReadOnlyList<StockItem> items;

    public StockItemListToFinancialSeriesDataAdapter(IReadOnlyList<StockItem> items) {
        this.items = items;
    }

    public override int DataCount => (items != null) ? items.Count: 0;
    public override NSDate GetArgumentByIndex(int index) {
        DateTime period = items[index].Period;
        if (period.Kind == DateTimeKind.Unspecified) {
            period = DateTime.SpecifyKind(period, DateTimeKind.Utc);
        }
        return (NSDate)period;
    }
    public override double GetOpenValueByIndex(int index) => items[index].Open;
    public override double GetHighValueByIndex(int index) => items[index].High;
    public override double GetLowValueByIndex(int index) => items[index].Low;
    public override double GetCloseValueByIndex(int index) => items[index].Close;
}

public class StockItem {
    public DateTime Period { get; }
    public double Open { get; }
    public double High { get; }
    public double Low { get; }
    public double Close { get; }

    public StockItem(DateTime period, double open, double high, double low, double close) {
        Period = period;
        Open = open;
        High = high;
        Low = low;
        Close = close;
    }
}
The code above uses the classes and members below:
Symbol | Description |
|---|---|
| Displays data as a set of vertical lines with horizontal dashes. Each vertical line represents the price range (high and low price values) for a given data point. The left horizontal dash displays the opening price and the right dash shows the closing price. |
Gets or sets data the series display on the Chart. | |
|
Important
A data provider fot the series must implement the DXFinancialSeriesData interface; otherwise all point values will equal to zero.
How to: Customize Series Point Labels
Labels accompany series points and show series points’ values as text on a chart:
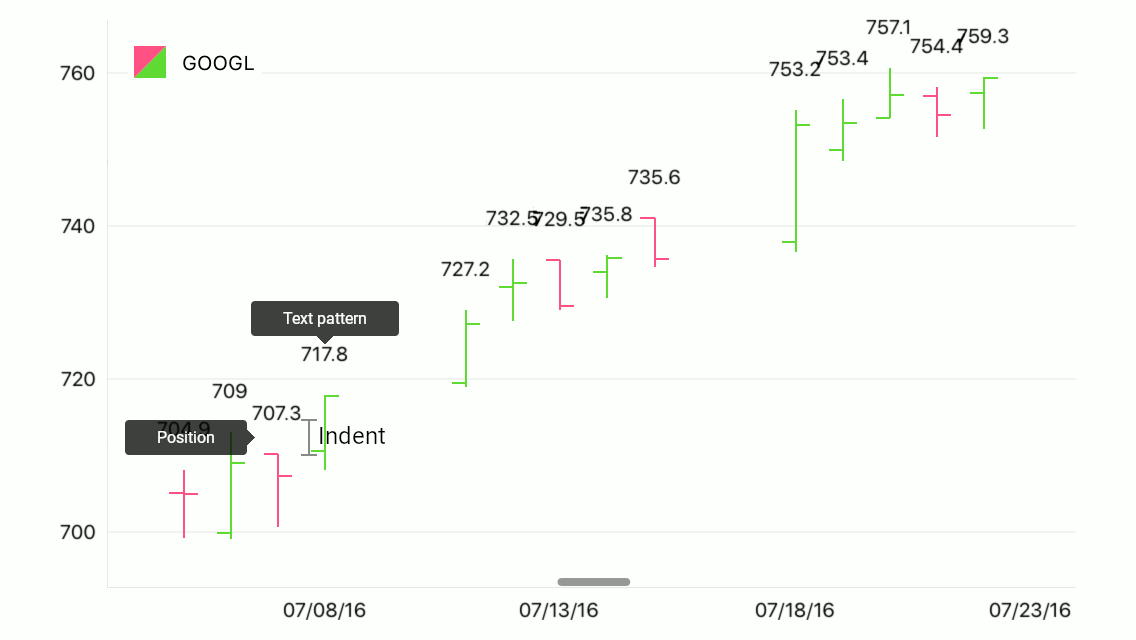
The following code specifies the Area series’s label settings:
financialSeries.Label = new DXFinancialSeriesLabel {
    Position = DXFinancialSeriesLabelPosition.Top,
    Indent = 15,
    TextPattern = "{C$#.#}",
};
The example above utilizes the classes and properties below:
Symbol | Description |
|---|---|
| |
| |
| |
| |
|
The text pattern can utilize the following value placeholders to generate the labels’ text:
| Placeholder | Description |
|---|---|
| {S} | Displays a series name. |
| {A} | Displays a series point argument. |
| {O} | Displays a financial series point open value. |
| {H} | Displays a financial series point high value. |
| {L} | Displays a financial series point low value. |
| {C} | Displays a financial series point close value. |
Note
These values can be formatted using default format strings after the $ sign.
For example, in the {C$#.##} string, C is a placeholder, $ is a format string separator, and #.## is a format string.
How to: Specify Text the Legend Displays
The legend displays legend items for each series or series point the chart displays. A legend item includes a color marker and text that explains data the series/series point shows:

The following code manages text the legend displays for the series:
series.LegendTextPattern = "Stocks: {S}";
The LegendTextPattern property configures the text the legend item contains. The default legend text is the series’s DisplayName.
How to: Manage the Series Interaction with the Hint
The chart Hint interacts with series to request values to display, to ask a series what axis lines the Crosshair should display, etc:

The following code specifies how the hint displays the series:
series.HintOptions = new DXSeriesCrosshairOptions {
    PointTextPattern = "{S}\r\nO: ${O$#.#}\r\nH: ${H$#.#}\r\nL: ${L$#.#}\r\nC: ${C$#.#}",
    ShowInLabel = true,
    AxisLineHidden = false,
    AxisLabelHidden = false,
};
The series can utilize the classes and properties below to configure how the hint displays it:
Symbol | Description |
|---|---|
| |
| |
| |
| |
| |
|
Note
Properties the DXSeriesCrosshairOptions class introduces do not affect the hint when the hint’s Behavior is set to DXTooltipHintBehavior. At the same time, all properties the class inherits from its parent influence the hint.
The point text pattern and series text pattern can utilize the following value placeholders to generate hint items’ text:
| Placeholder | Description |
|---|---|
| {S} | Displays a series name. |
| {A} | Displays a series point argument. |
| {O} | Displays a financial series point open value. |
| {H} | Displays a financial series point high value. |
| {L} | Displays a financial series point low value. |
| {C} | Displays a financial series point close value. |
Note
These values can be formatted using default format strings after the $ sign.
For example, in the {C$#.##} string, C is a placeholder, $ is a format string separator, and #.## is a format string.
How to: Configure Series Appearance
The series style provides the following parameters that specify a series’ appearance:
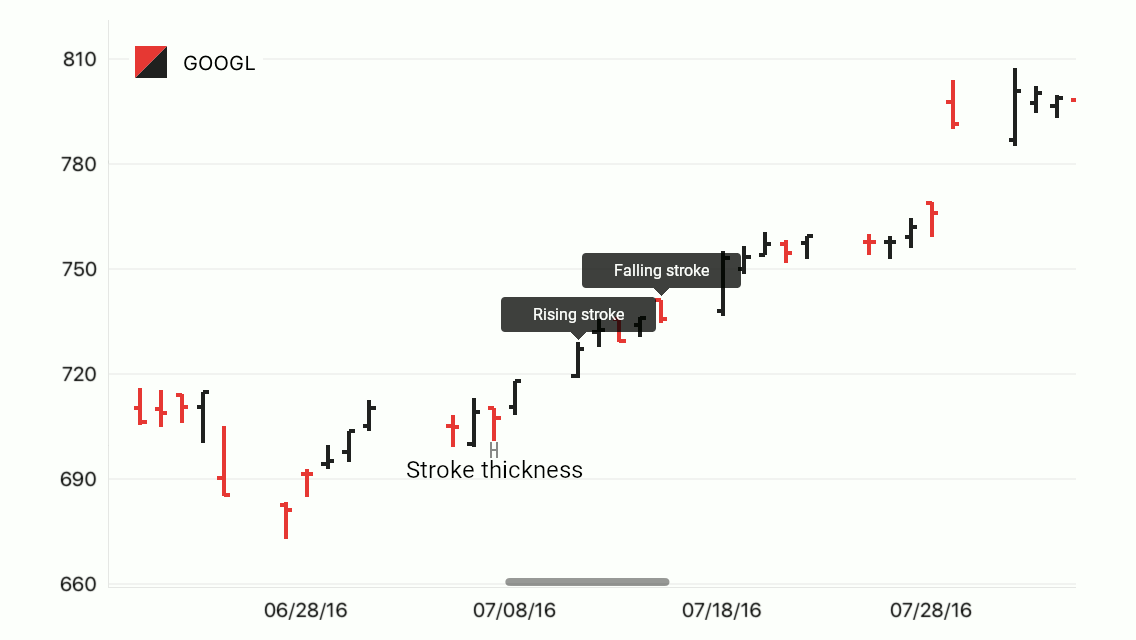
The code below customizes the Stock series’s appearance:
stockSeries.Style = new DXStockSeriesStyle {
    StrokeThickness = 2,
    RisingStroke = UIColor.FromWhiteAlpha(0.129f, 1.000f),
    FallingStroke = UIColor.FromRGBA(0.898f, 0.224f, 0.208f, 1.000f)
};
This code utilizes the following classes and members:
Symbol | Description |
|---|---|
| |
| |
| |
| |
|