Series
- 5 minutes to read
The Series manages data and its appearance on the chart. The following image represents several series on charts:
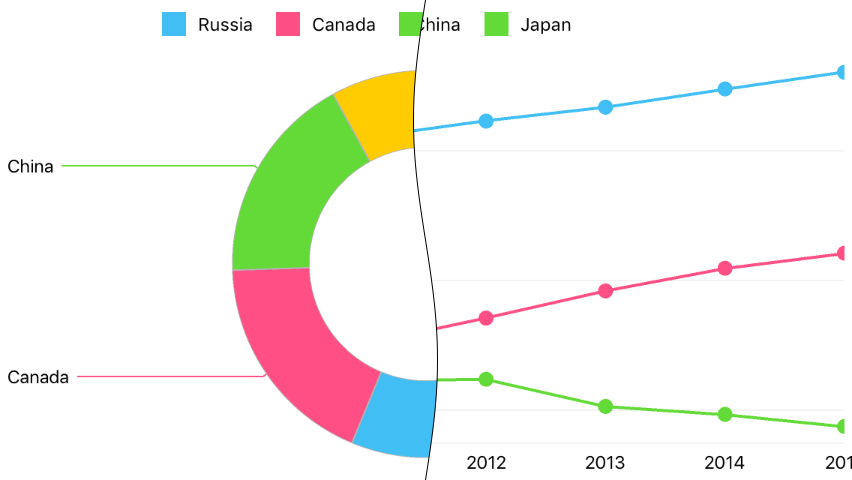
Note that, a chart’s series should be compatible with the chart type. Refer to the Pie Series and Cartesian Series guides for more information.
How to: Provide series data
All series interact with their data sources using Data interfaces. The following code snippets demonstrate how to implement one of them:
// Interfaces declaration.
@interface Gdp : NSObject
    @property NSDate *year;
    @property double value;

    +(instancetype) gdpWithYear: (NSDate *)year andValue: (double)value;
@end

@interface GdpData : NSObject <DXDateTimeSeriesData>
    +(instancetype) dataWithArray: (NSArray<Gdp *> *)gdps;
@end

// Interfaces implementation.
@implementation Gdp
    +(instancetype) gdpWithYear:(NSDate *)year andValue: (double)value {
        Gdp *gdp = [[Gdp alloc] init];
        gdp.year = year;
        gdp.value = value;
        return gdp;
    }
@end

@implementation GdpData {
    NSArray<Gdp *> *gdps;
}
    +(instancetype) dataWithArray:(NSArray<Gdp *> *)gdps {
        GdpData *data = [[GdpData alloc] init];
        data->gdps = gdps;
        return data;
    }

    -(int) getDataCount {
        return (int)[gdps count];
    }

    -(NSDate *)getArgumentByIndex: (int)index {
        return [gdps objectAtIndex:index].year;
    }

    -(double) getValueByIndex: (int) index {
        return [gdps objectAtIndex:index].value;
    }
@end

// ...
DXLineSeries *lineSeries = [[DXLineSeries alloc] init];
lineSeries.data = [GdpData dataWithArray:gdps];
[self.chart addSeries:lineSeries];
// ...
Note
The series Data source type should be compatible with the axis type in the Cartesian chart; otherwise series is not plotted on the chart. Refer to the Series: Data Providing guide to learn more.
The table below represents all symbols required to specify data.
| Symbol | Description |
|---|---|
| DXPieSeries.data | Gets or sets the Pie (Donut) series’s data. |
| DXSeries.data | Gets or sets the Cartesian series’s data. |
| DXPieSeriesData | The DXPieSeries data source’s protocol. |
| DXQualitativeSeriesData | The protocol of a DXSeries‘s data with qualitative arguments. |
| DXWeightedQualitativeSeriesData | The protocol of a DXBubbleSeries‘s data with qualitative arguments and value-weight values. |
| DXNumericSeriesData | The protocol of a DXSeries‘s data with numeric arguments. |
| DXWeightedNumericSeriesData | The protocol of a DXBubbleSeries‘s data with numeric arguments and value-weight values. |
| DXDateTimeSeriesData | The protocol of a DXSeries‘s data with date-time arguments. |
| DXWeightedDateTimeSeriesData | The protocol of a DXBubbleSeries‘s data with date-time arguments and value-weight values. |
| DXFinancialSeriesData | The protocol of a DXStockSeries or DXCandleStickSeries series’s data with date-time arguments and Open-High-Low-Close values. |
Refer to the Data Providing guide for more information.
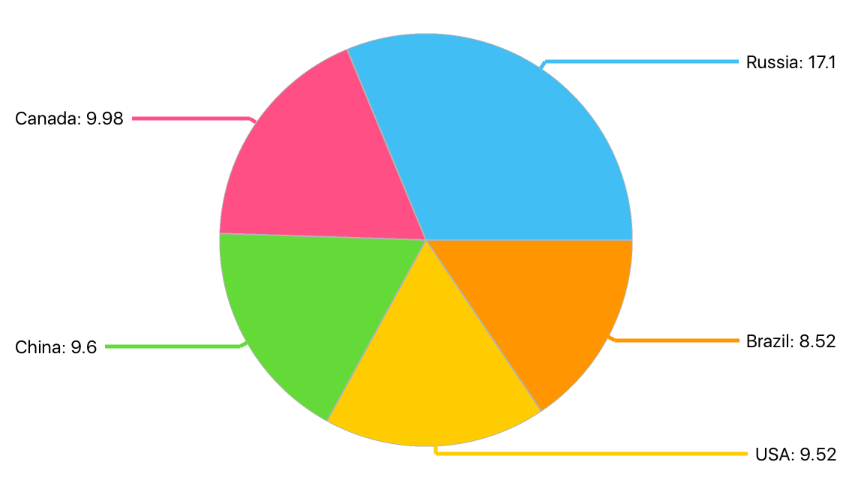
How to: configure series point labels
Labels can accompany series points. Note that different series types have different label settings. The image below demonstrates a Line series’s customized point labels with highlighted parameters available for configuration.
The following code snippet demonstrates how to configure a Line series point labels:
DXMarkerSeriesLabel *seriesLabel = [[DXPieSeriesLabel alloc] init];
seriesLabel.hidden = DXDefaultBooleanNo;
seriesLabel.textPattern = @"{L}: {V$##.##}";
seriesLabel.position = DXPieSeriesLabelPositionTwoColumns;

series.label = seriesLabel;
Use a series’s label property to access the settings that specifies the contents, position and appearance of series point labels.
In the code above, series label placeholders (L and V) specify a series point value that should be added to the label. The following label placeholders are available:
| Placeholder | Description |
|---|---|
| {S} | Displays a series name. |
| {A} | Displays a series point argument. |
| {L} | Displays a pie series point label. |
| {V} | Displays a series point value. |
| {VP} | Displays a series point value as percentages. |
| {W} | Displays a Bubble series point weight. |
| {O} | Displays a financial series point open value. |
| {H} | Displays a financial series point high value. |
| {L} | Displays a financial series point low value. |
| {C} | Displays a financial series point close value. |
Note
These values can be formatted using default format strings after the $ sign.
For example, in the {VP$#.##} string, VP is a placeholder, $ is a format string separator, and #.## is a format string.
Refer to the Series: Labels guide to learn more about series labels.
How to: Customize appearance of series
A series’ appearance parameters depend on the series type. The following image demonstrates customizable appearance parameters:
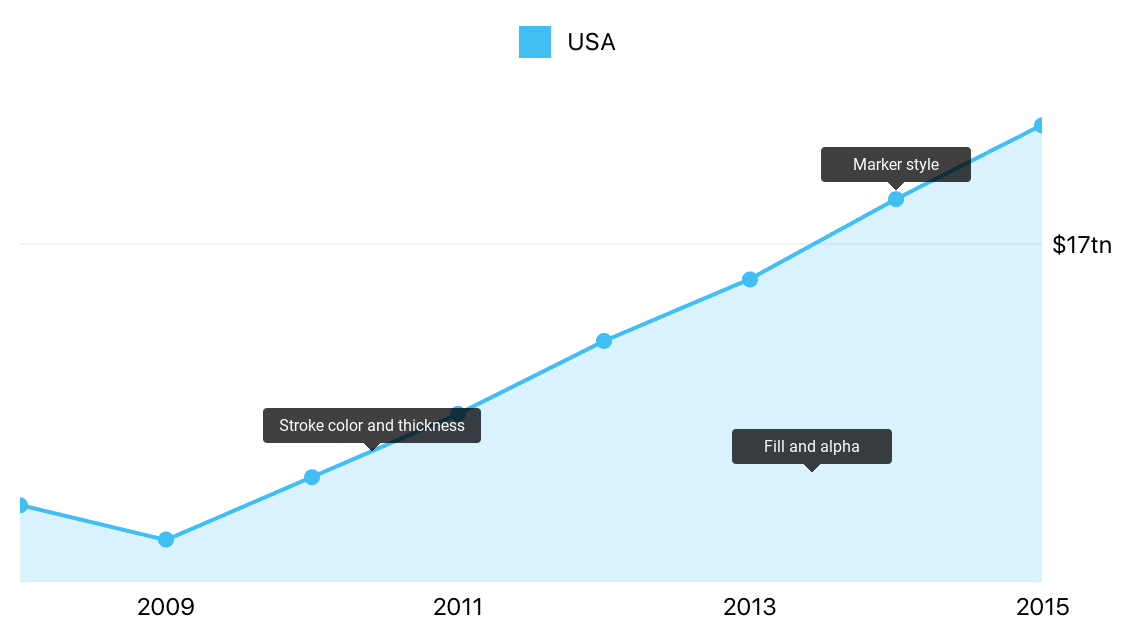
Each series has style parameters, available via the style property. Refer to the required series type reference for more information.