DXSeries Class
The base class for all series the DXChart displays.
Namespace: DevExpress.Xamarin.iOS.Charts
Assembly: DevExpress.Xamarin.iOS.Charts.dll
Declaration
public class DXSeries :
    DXSeriesBase
Related API Members
The following members return DXSeries objects:
Remarks
Note that you should use the DXSeries class’ descendants to display data in DXChart instead of utilizing this class directly.
This topic contains general series customization information.
Refer to descendant class descriptions to learn more about their features.
How to: Manage Series Data
This example demonstrates how to implement the adapter of a model object collection to date-time series data:
// In the ViewDidLoad method.
List<AnnualIncomeData> devAVNorthAnnualSales = new List<AnnualIncomeData> {
    new AnnualIncomeData(new DateTime(2012), 277),
    new AnnualIncomeData(new DateTime(2013), 328.5),
    new AnnualIncomeData(new DateTime(2014), 297),
    new AnnualIncomeData(new DateTime(2015), 255.3),
    new AnnualIncomeData(new DateTime(2016), 173.5),
    new AnnualIncomeData(new DateTime(2017), 131.8)
};

this.chart.AddSeries(
    new DXAreaSeries {
        DisplayName = "DevAV North"
        Data = new AnnualIncomeListToDateTimeSeriesDataAdapter(devAVNorthAnnualSales)
    }
);
// ...

class AnnualIncomeListToDateTimeSeriesDataAdapter: DXDateTimeSeriesData {
    List<AnnualIncomeData> adaptee;

    public AnnualIncomeListToDateTimeSeriesDataAdapter(List<AnnualIncomeData> list) {
        adaptee = list;
    }

    public override int DataCount => (adaptee != null) ? adaptee.Count : 0;
    public override NSDate GetArgumentByIndex(int index) => (NSDate)adaptee[index].Year;
    public override double GetValueByIndex(int index) => adaptee[index].Income;
}

class AnnualIncomeData {
    public Date Year { get; }
    public double Income { get; }

    public DepartmentIncome(Date year, double income) {
        Year = (year.Kind != DateTimeKind.Unspecified) ? year : DateTime.SpecifyKind(year, DateTimeKind.Local);
        Income = income;
    }
}
The code above uses the classes and members below:
Symbol | Description |
|---|---|
Displays data as filled areas on a chart, with each data point as a peak or hollow in the area. | |
Gets or sets data the series display on the Chart. | |
|
The primary series task is to provide data the DXChart displays. A series utilizes one of the following classes as its Data property value to load data:
Data interface | Description |
|---|---|
| |
The DXBubbleSeries series requires this data class. | |
| |
The DXBubbleSeries series requires this data class. | |
| |
The DXBubbleSeries series requires this data class. | |
The DXStockSeries and DXCandleStickSeries series require this data interface. Note that all series point values equal zero when you use this data class with other series types. | |
The DXCalculatedSeries ancestors require this data class. |
Important
The data class the series uses should be compatible with the type of object assigned to the DXChart.AxisX property; otherwise, the Chart does not display the series. The Chart view creates an axis that is compatible with the first series’ data class if you do not specify its AxisX property value.
How to: Specify Text the Legend Displays
The legend displays legend items for each series or series point the chart displays. A legend item includes a color marker and text that explains data the series/series point shows:

The following code manages text the legend displays for the series:
series.LegendTextPattern = "Department: {S}";
The LegendTextPattern property configures the text items contain. The default legend text is:
- for a series - its DisplayName.
- for a series point - its value converted to a string.
Note
The legend displays items for series points when the ColorEach property is set to true.
The text pattern can utilize the following value placeholders to generate legend items’ text:
| Placeholder | Description |
|---|---|
| {S} | Displays a series name. |
| {A} | Displays a series point argument. |
| {V} | Displays a series point value. |
Note
These values can be formatted using default format strings after the $ sign.
For example, in the {V$#.##} string, V is a placeholder, $ is a format string separator, and #.## is a format string.
How to: Manage the Series Interaction with the Hint
The chart Hint interacts with series to request values to display, to ask series what axis lines the Crosshair should display, etc:
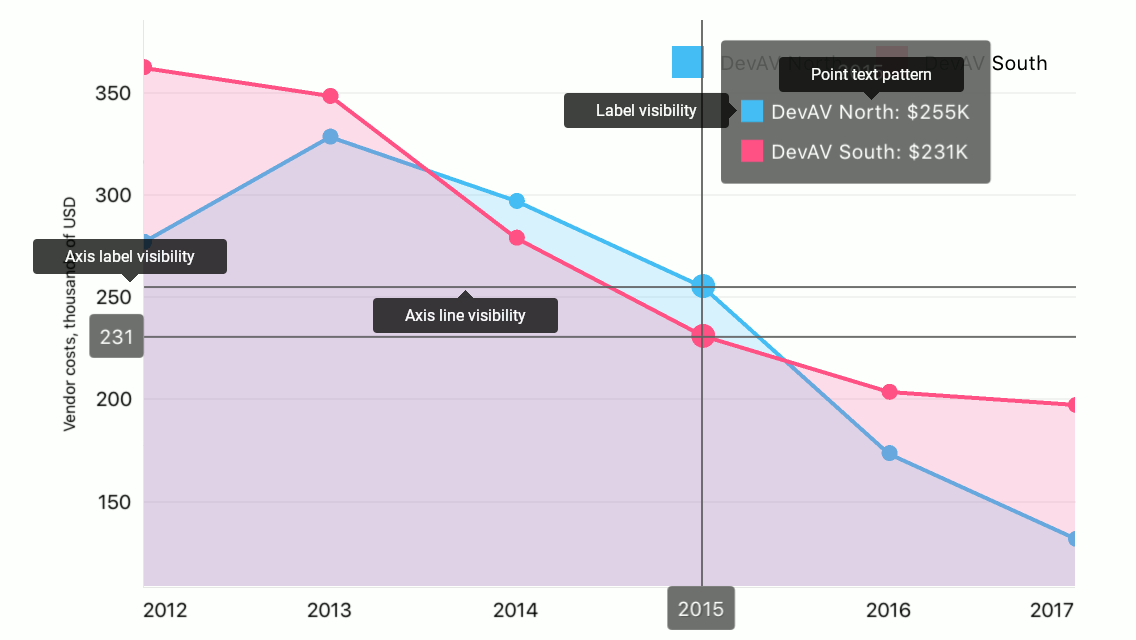
The following code specifies how the hint displays the series:
series.HintOptions = new DXSeriesCrosshairOptions {
    PointTextPattern = "{S}: ${V$##}K",
    ShowInLabel = true,
    AxisLineHidden = false,
    AxisLabelHidden = true,
};
The series can utilize the classes and properties below to configure how the hint displays it:
Symbol | Description |
|---|---|
| |
| |
| |
| |
| |
|
Note
Properties the DXSeriesCrosshairOptions class introduces do not affect the hint when the hint’s Behavior is set to DXTooltipHintBehavior. At the same time, all properties the class inherits from its parent influence the hint.
The point text pattern and series text pattern can utilize the following value placeholders to generate hint items’ text:
| Placeholder | Description |
|---|---|
| {S} | Displays a series name. |
| {A} | Displays a series point argument. |
| {V} | Displays a series point value. |
Note
These values can be formatted using default format strings after the $ sign.
For example, in the {V$#.##} string, V is a placeholder, $ is a format string separator, and #.## is a format string.