DXDateTimeAxisX Class
The X-axis that manages date-time arguments.
Namespace: DevExpress.Xamarin.iOS.Charts
Assembly: DevExpress.Xamarin.iOS.Charts.dll
Declaration
public class DXDateTimeAxisX :
    DXAxisX
Remarks
Use this axis to display series that use the following data protocols:
The date-time X-axis contains the following elements:
How to: Specify chart axes
The chart creates default axes taking into account the first series’ Data type. Specify the chart’s AxisX property to customize the axis the chart uses:
self.chart.AxisX = new DXDateTimeAxisX {
  MeasureUnit = DXDateTimeMeasureUnit.Hour
};
How to: change axis range
The chart automatically calculates the axes’ ranges based on chart series values. A range object defines a full and visual range. The Full Range specifies the overall range of data displayed on the Chart and the Visual Range defines the range of the current chart viewport:
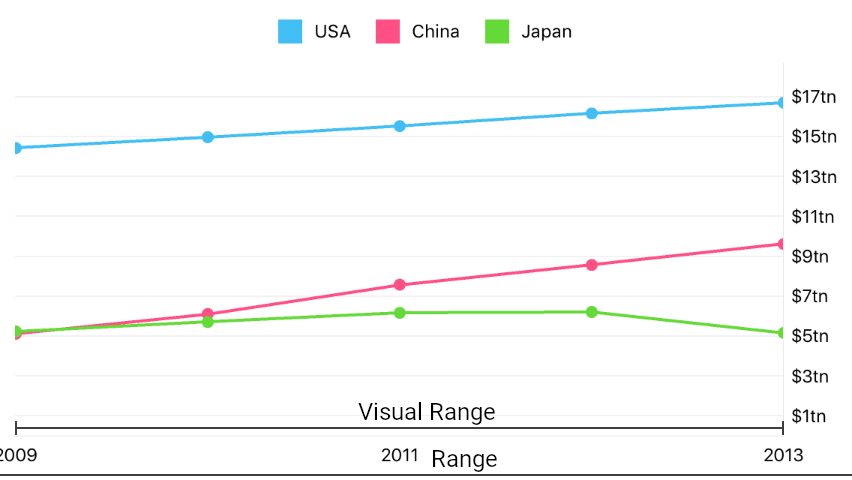
The following code specifies a custom range:
axisX.Range = new DXDateTimeRange {
    Min = new DateTime(2008, 1, 1),
    Max = new DateTime(2015, 1, 1),
    VisualMin = new DateTime(2009, 1, 1),
    VisualMax = new DateTime(2013, 1, 1)
};
The following table contains the main symbols allowing you to specify ranges. Note that each axis type has a range type:
Symbol | Description |
|---|---|
| |
|
How to: Customize axis scale parameters
The following image shows the Date-Time Axis‘s scale parameters:
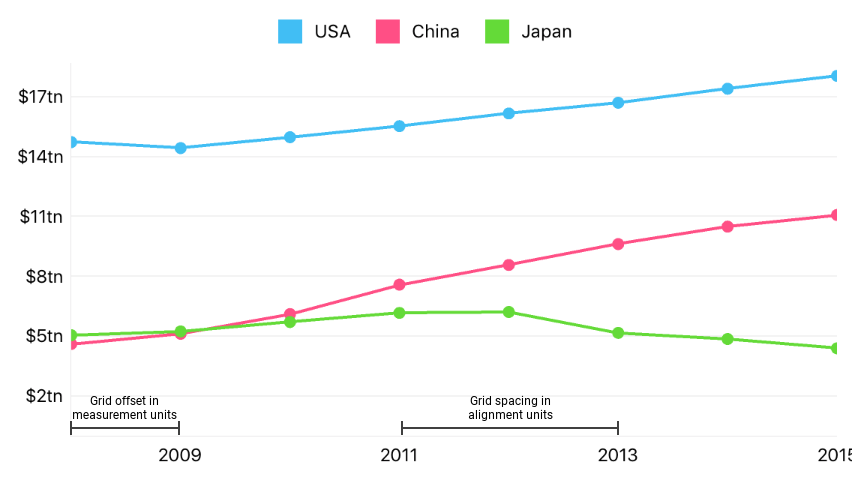
The code below configures the scale as in the image above:
this.chart.AxisX = new DXDateTimeAxisX {
    // If series data provides more detailed data than the measurement unit, for example, by hours,
    MeasureUnit = DXDateTimeMeasureUnit.Day,
    // data will be aggregated using the function specified by this aggregation type.
    AggregationType = DXAggregationType.Avg,

    // Unit used to align grid may be different from the measure unit.
    // But it should be less detailed.
    GridAlignment = DXDateTimeMeasureUnit.Week,
    // The Offset and Spacing are in alignment units.
    // Grid Offset - specifies how many units are skipped before
    // the first major tickmark and gridline.
    GridOffset = 1,
    // Grid Spacing - distance between two major tickmarks and gridlines, in units.
    GridSpacing = 2,
};
The following table lists all symbols that specify a date-time axis’s scale parameters:
Symbol | Description |
|---|---|
| |
| |
| |
| |
|
How to: Manage an axis’ labels
Axis Labels labels show textual representations of axis values at major tick marks:
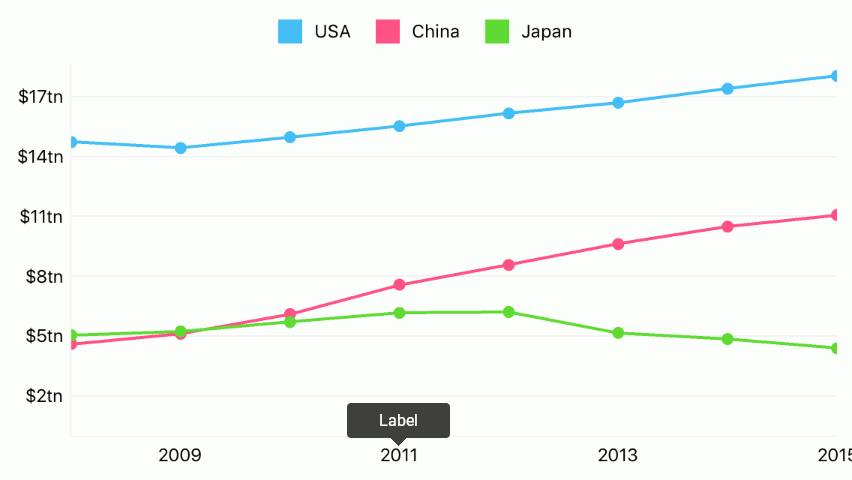
The axis label converts an axis value using the format string or a text provider object. The following code uses the format string to customize label content:
axisX.Label = new DXAxisLabel {
    Format = "yyyy",
};
| |
| |
| |
| |
|
How to: Customize the axis title
The Axis Title allows you to display text that explains the axis values.
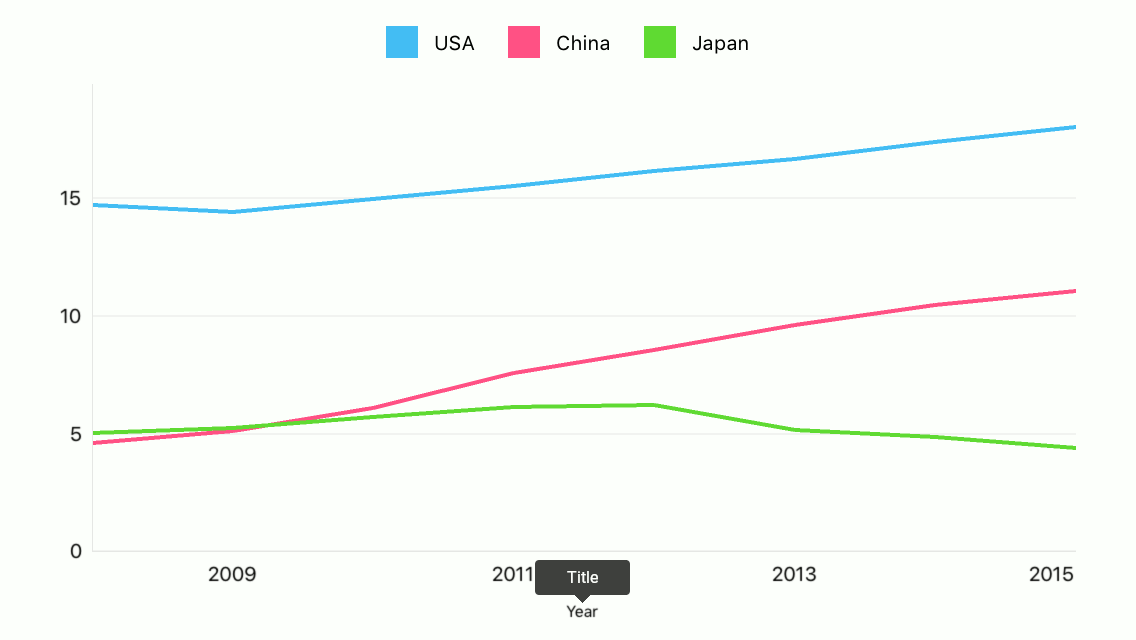
The following code demonstrates how to specify an axis’ title:
axisX.Title = new DXAxisTitle() {
    Text = "Year",
    Alignment = DXAxisTitleAlignment.Far
};
The code above uses the following classes and members:
| |
|
How to: Add a constant line
Constant lines provide the capability to highlight a value on an axis:
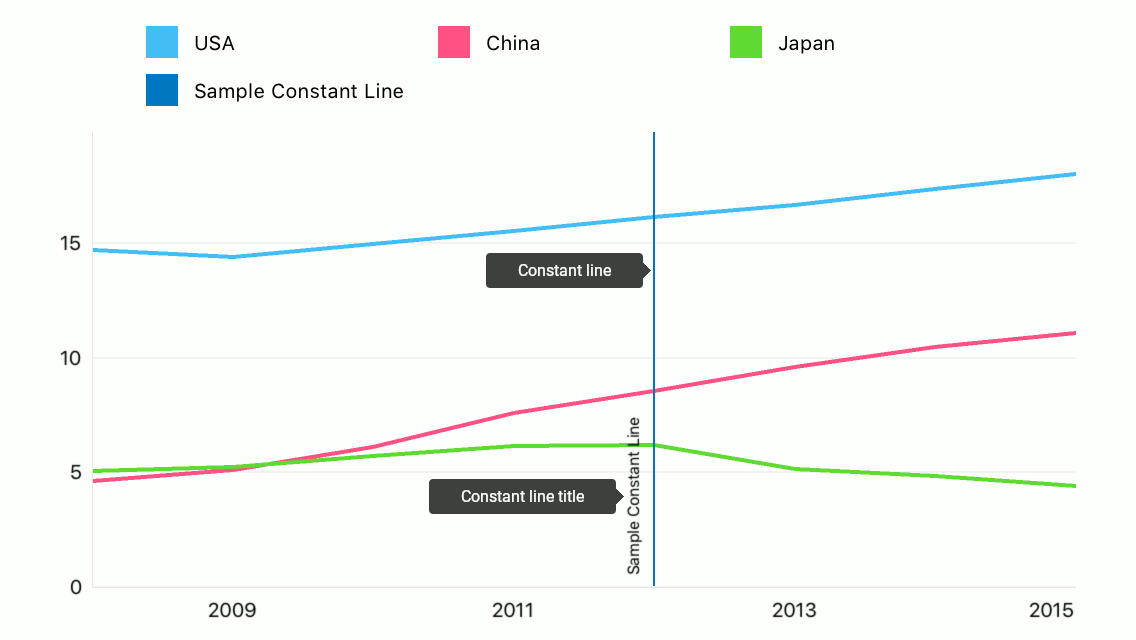
The following example demonstrates how to configure a constant line:
axisY.AddConstantLine(new DXDateTimeConstantLine(new DateTime(2012, 1, 1)) {
    Title = new DXConstantLineTitle {
        Text = "Sample Constant Line",
    },
    ShowTitleBelowLine = true,
    LegendText = "Sample Constant Line",
    ShowInLegend = true,
});
The following classes and members allow you to configure a constant line:
| |
| |
| |
|
How to: Add a strip
Strips provide the capability to highlight axis ranges:
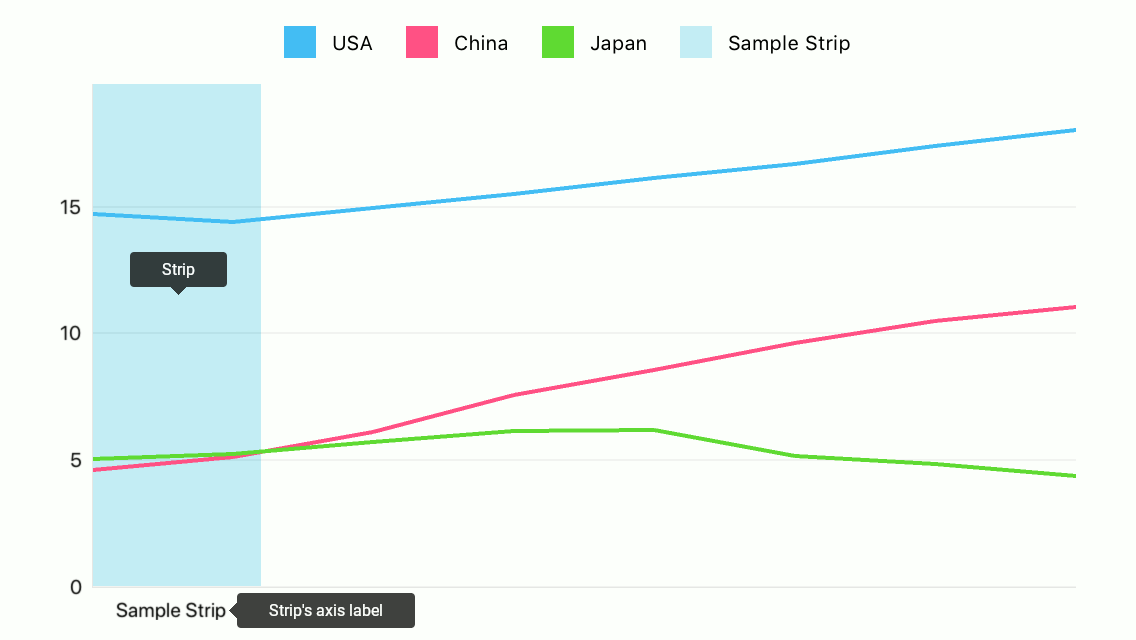
The following example demonstrates how to configure a strip:
axisY.AddStrip(new DXDateTimeStrip() {
    MaxLimit = new DateTime(2009, 2, 1),
    MinLimitEnabled = false,
    Label = new DXStripAxisLabel {
        Text = "Sample Strip",
    },
    AxisLabelHidden = false,
    LegendText = "Sample Strip",
    LegendTextHidden = false
});
The following classes and members allow you to configure a strip:
| |
| |
| |
|
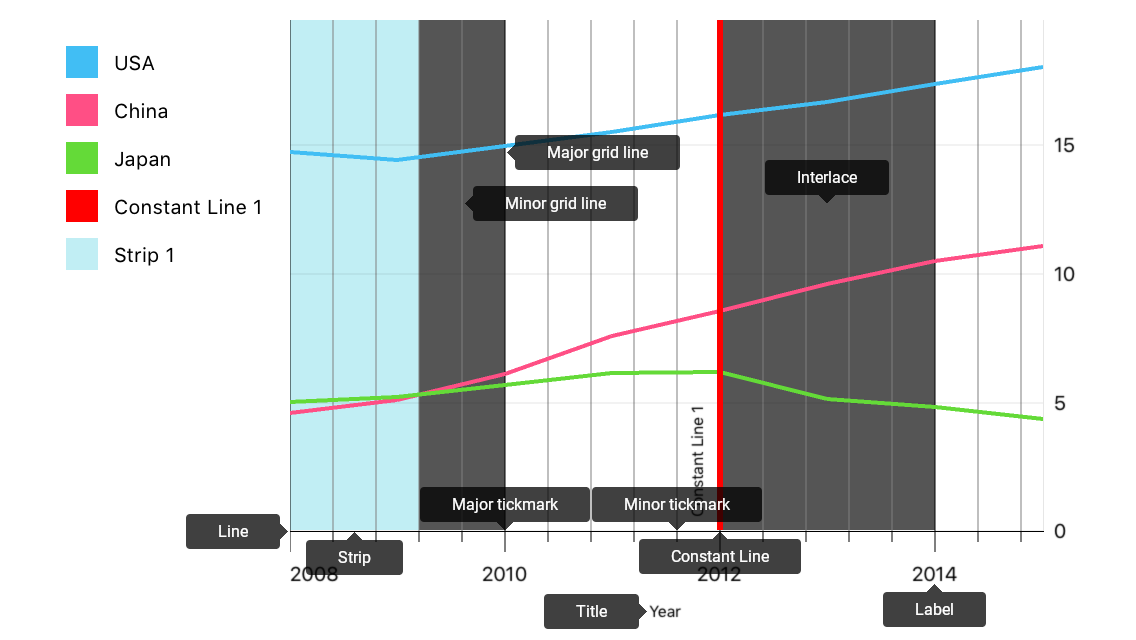
How to: Configure appearance of axis elements
The following image shows axis elements whose appearance the axis style manages:
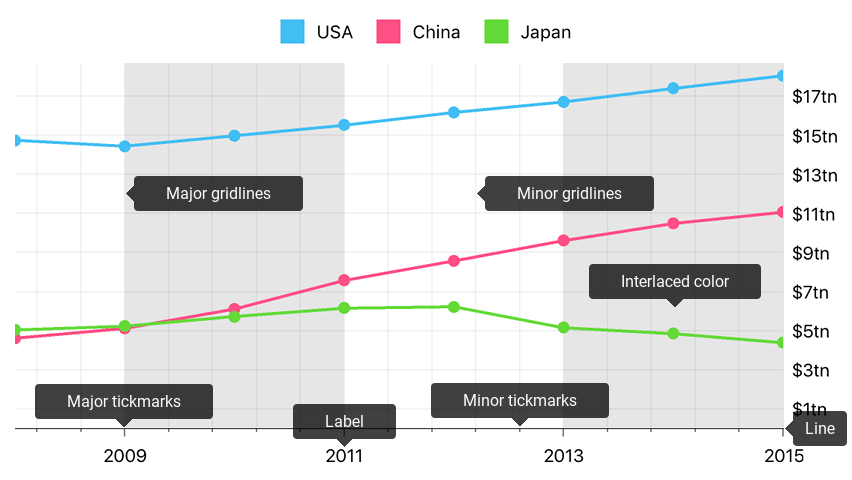
You should configure all other elements’ appearance using an element Style property.
The code below configures the axis as the image above displays:
// All sizes are in screen points.
axisX.style = new DXAxisStyle {
    LineHidden = false,
    MajorGridlinesHidden = false,
    MinorGridlinesHidden = false,
    MajorTickmarksHidden = false,
    MinorTickmarksHidden = false,

    LineColor = UIColor.darkGray,
    MajorGridlinesColor = UIColor.gray,
    MinorGridlinesColor = UIColor.lightGray
};

axisX.Label.Style = new DXAxisLabelStyle {
    TextStyle = new DXTextStyle {
        FontSize = 10
    }
};
The following table lists classes and properties that specify how an axis and axis elements look:
Symbols | Description |
|---|---|
| |
| |
| |
| |
| |
| |
| |
|