Accessibility in Blazor Range Selector
- 4 minutes to read
DevExpress Blazor Range Selector allows you to configure visual cues and interaction options to improve accessibility. These settings help users perceive and understand visual content.
This topic lists techniques that help your charts align with WCAG criteria for Use of Color, Non-text Contrast, and Dragging Movements.
Use of Color
The Use of Color criterion requires visual cues other than color, such as shapes or text, to convey meaning. The Range Selector relies on visual presentation to convey information, so you need to configure your component to meet this criterion using the following techniques:
- Apply a different dash style to each line-based series.
- Customize point size, symbol, and image in area- and line-based series using DxChartSeriesPoint and DxChartSeriesPointImage objects.
- Configure series labels to display arguments and values. We recommend that you display both, as this meets the Non-text Contrast criterion. If you display only values, add a label connector.
- Use chart titles and subtitles to explain chart-wide information.
Non-Text Contrast
You can use the following techniques to meet the Non-text Contrast criterion:
- Configure series labels to display argument and values.
Use a custom high-contrast palette. You can create your own palette based on specific user needs or use the following set of colors:
#228833,#ccbb44,#ee6677,#aa3377,#4477aa,#66ccee,#bbbbbb.If your chart contains many series, use the
AlternateorBlendpalette extension mode.The following image illustrates the use of the suggested high-contrast palette. The available palette colors appear on the right, and the Range Selector that uses this palette with the
Blendextension mode appears on the left: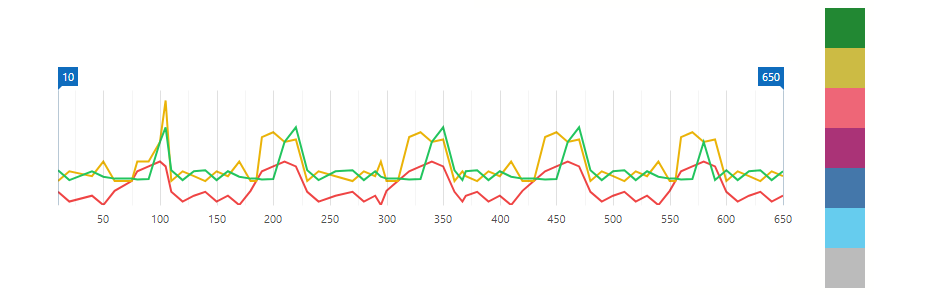
<DxRangeSelector Width="100%"
                 Data="@Data"
                 SelectedRangeStartValue="RangeSelectorStartValue"
                 SelectedRangeEndValue="RangeSelectorEndValue">
    <DxRangeSelectorChart Palette="@(new string[] { "#ef4444", "#eab308", "#22c55e",
                                                    "#0ea5e9", "#8b5cf6", "#ec4899" })"
                          PaletteExtensionMode="ChartPaletteExtensionMode.Blend">
        @CreateChartLineSeries(s => s.Y1)
        @CreateChartLineSeries(s => s.Y2)
        @CreateChartLineSeries(s => s.Y3)
    </DxRangeSelectorChart>
    <DxRangeSelectorScale TickInterval="50" />
</DxRangeSelector>
Dragging Movements
Users can change the selected range as follows:
- Drag slider handles.
- Click outside the current range to shift selection (MoveSelectedRangeByClick).
- Use the mouse to select a new range (AllowMouseSelection).

You can introduce accessibility-friendly zoom and pan operations (that conform to the Dragging Movements criteria) using built-in selected range API:
- Create a Range Selector and populate it with data.
- Add two DxSpinEdit<T> components to allow users to enter minimum and maximum range values using the keyboard.
- Disable component animations to avoid re-rendering when a user edits range values.
- Implement selected range updates based on user input (review a sample implementation below).
@inject IRangeSelectorZoomingDataProvider RangeSelectorZoomingDataProvider
@* ... *@
<DxRangeSelector Width="100%"
                 Data="@Data"
                 AnimationEnabled="@RangeSelectorAnimationEnabled"
                 SelectedRangeStartValue="RangeSelectorStartValue"
                 SelectedRangeEndValue="RangeSelectorEndValue"
                 ValueChanged="OnValueChanged"
                 ValueChangeMode="RangeSelectorValueChangeMode.OnHandleMove">
    <DxRangeSelectorChart>
        @CreateChartAreaSeries(s => s.Y1)
        @CreateChartAreaSeries(s => s.Y2)
        @CreateChartAreaSeries(s => s.Y3)
    </DxRangeSelectorChart>
    <DxRangeSelectorScale TickInterval="50" />
</DxRangeSelector>

<div class="range-btns">
    <div class="range-btns-item">
        <label for="minSpinEdit" class="demo-text cw-320 mb-1">
            Min Value:
        </label>
        <DxSpinEdit Value="StartValue"
                    T="double"
                    ValueChanged="OnSpinEditStartValueChanged"
                    InputId="minSpinEdit"
                    CssClass="cw-320"
                    Increment="10"
                    MinValue="10"
                    MaxValue="650"
                    BindValueMode="BindValueMode.OnInput" />
    </div>

    <div>
        <label for="maxSpinEdit" class="demo-text cw-320 mb-1">
            Max Value:
        </label>
        <DxSpinEdit Value="EndValue"
                    T="double"
                    ValueChanged="OnSpinEditEndValueChanged"
                    InputId="maxSpinEdit"
                    CssClass="cw-320"
                    Increment="10"
                    MinValue="10"
                    MaxValue="650"
                    BindValueMode="BindValueMode.OnInput" />
    </div>
</div>
@* ... *@
@code {
    double StartValue = 10;
    double EndValue = 650;
    double RangeSelectorStartValue = 10;
    double RangeSelectorEndValue = 650;
    bool RangeSelectorAnimationEnabled = true;
    List<ZoomingData> Data;

    void OnSpinEditStartValueChanged(double newStartValue) {
        if (newStartValue > EndValue) {
            StartValue = EndValue;
            return;
        }

        StartValue = newStartValue;
        RangeSelectorStartValue = StartValue;
    }

    void OnSpinEditEndValueChanged(double newEndValue) {
        if (newEndValue < StartValue) {
            EndValue = StartValue;
            return;
        }

        EndValue = newEndValue;
        RangeSelectorEndValue = EndValue;
    }

    void OnValueChanged(RangeSelectorValueChangedEventArgs info) {
        StartValue = (double)info.CurrentRange[0];
        EndValue = (double)info.CurrentRange[1];
    }

    protected override void OnInitialized() {
        Data = RangeSelectorZoomingDataProvider.GetData();
    }
@* ... *@
    private RenderFragment CreateChartAreaSeries(Expression<Func<ZoomingData, double>> valueField) =>
        @<DxChartAreaSeries ArgumentField="@(s => s.Arg)"
                            ValueField="@(valueField)">
        </DxChartAreaSeries>;

    protected override void OnAfterRender(bool firstRender) {
        if (firstRender) {
            RangeSelectorAnimationEnabled = false;
        }
    }

}