Getting Started
- 2 minutes to read
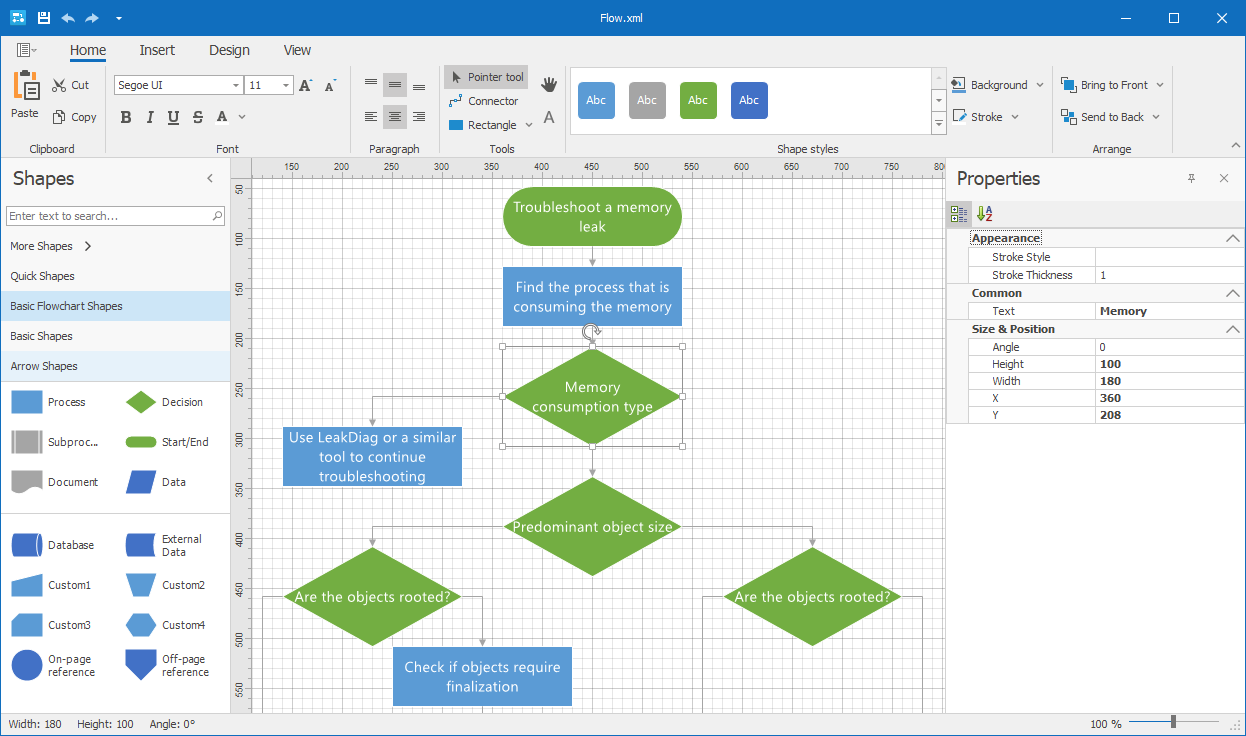
The XtraDiagrams suite provides components that allow you and your end-users to create and display diagrams of various types and styles.
Use 130 predefined shapes in any combination or add your own ones. The How to: Create Custom Shapes with Connection Points example illustrates how to create a basic custom shape. The SVG Shapes document describes how to create a shape based on Scalable Vector Graphics. Additionally, the Diagram Control allows you to use Images and Containers and Lists.
The Automatic Layout functionality provides the ability to automatically arrange shapes using one of the predefined drawing algorithms.
You and your end-users can apply predefined color schemes to diagrams. To learn more, see Themes and Styles.
Diagrams can be printed or exported to images. The Print Preview allows end-users to change printing options and see exactly how a diagram will look when it is printed. A diagram can also be saved to an XML file and then loaded from this file at design time and runtime. To learn more, see Saving and Loading Diagrams.
Diagram Control and Diagram Designer
To start using the XtraDiagram, drop the DiagramControl onto the form and run the application. By default, only basic diagram customization operations are available to end-users at runtime. These include:
- modifying shape text;
- moving and deleting shapes;
- cut/copy/paste operations;
- undo/redo functionality.
You can provide end-users with rich diagram customization features by creating the Diagram Designer that provides the ready user interface for creating, editing, saving and loading diagrams. To learn the basics of creating diagrams using the Diagram Designer, see Diagram Designer and End-User Interaction.

Data Binding and Auto Generation
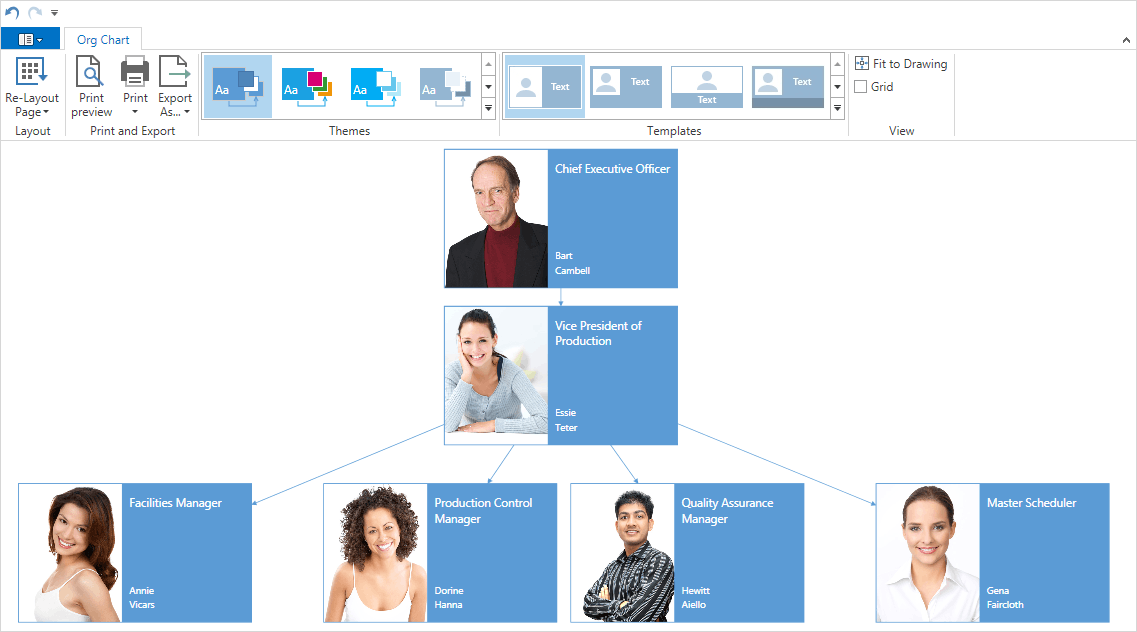
It is possible to bind the DiagramControl to data. The DiagramDataBindingController and DiagramOrgChartController allow you to automatically generate diagrams from a data source. You can customize the appearance of the generated diagram using the Item Template Designer. This functionality is demonstrated in the Diagram OrgChart demo. To learn more, see Data Binding Functionality.
