Panes Overview
- 2 minutes to read
This topic describes the fundamental concepts of panes in the ASP.NET Chart Control, including their purpose, implementation and capabilities. It also describes how secondary axes can be distributed among multiple panes. To learn more about chart elements and their hierarchy in the WebChartControl, refer to the following help topic: Chart Elements.
Panes are the visual areas within a chart’s diagram (for the XY-Diagram chart type only). All elements that belong to the Diagram object (axes, strips, constant lines, etc.) and the chart series are displayed within the Panes.
You can create multiple panes within a single diagram, and associate each series with a separate pane. Note that series must still have compatible view types, since they are plotted on the same diagram.
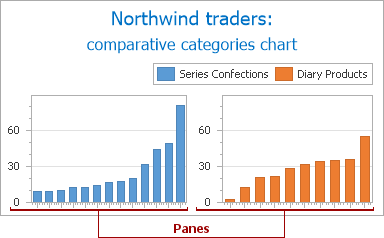
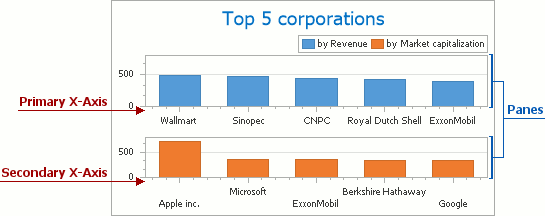
A typical scenario in which multiple panes are useful is when it is necessary to plot multiple chart series separately within the same chart. In many instances, you may need to use a secondary axis with additional panes. As with series, both primary and secondary axes can be plotted on separate panes, with respect to the series with which they are associated. You may also need to plot a primary axis through all panes, and create a secondary axis for each pane. The Axis2D.VisibilityInPanes property determines the panes in which an axis should be displayed. Refer to the following help topic to learn more: Primary and Secondary Axes.
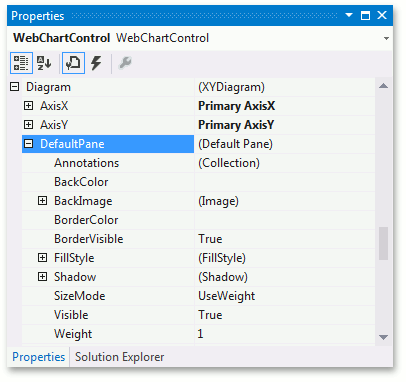
By default, a chart’s diagram includes an XYDiagramDefaultPane object, where the chart’s general data is shown (with the exception of the legend and chart titles). You can access its options from the XYDiagram2D.DefaultPane property, which is shown expanded in the Properties window, in the following image.
If you wish to display additional panes within a diagram, you can add them to the collection returned by the XYDiagram2D.Panes property. For more information, refer to the following help topic: Adding Panes.