Constant Lines
- 2 minutes to read
This topic describes how to display a constant line, and customize its appearance and position across an axis. Before you proceed with this section, you may wish to review the following help topic on axis fundamentals: Axes.
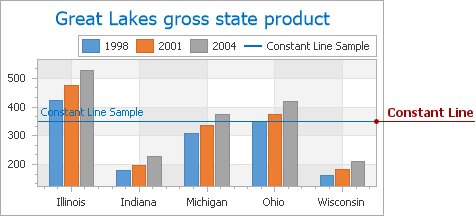
A Constant line displays a line that is perpendicular to the axis to which it belongs. It can be drawn in front of or behind the diagram‘s series.
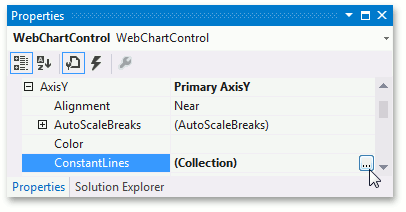
To create a constant line and add it to an axis at design time, locate the axis in the Properties window, and click the ellipsis button for the Axis2D.ConstantLines property.
This invokes the Constant Line Collection Editor.
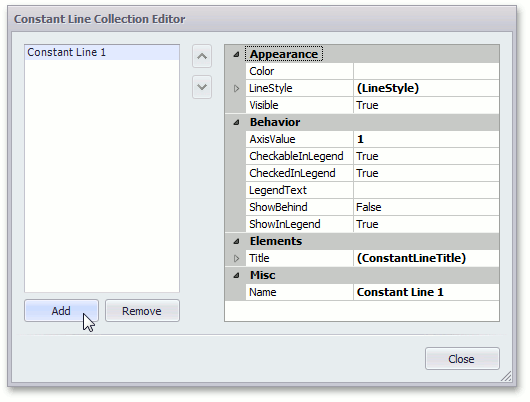
Click Add to create a constant line, and define its properties.
The key property of a constant line is the ConstantLine.AxisValue property, which determines the value on the axis across which the constant line is drawn. This value should fall into the range defined for the current axis, in order for the constant line to be visible on a diagram.
Also note that this value should match the axis scale type (see the images below).
| AxisValue = 10 | AxisValue = “D” |
|---|---|
 |
 |
You can control whether a constant line should be drawn behind or in front of a chart’s series. To do this, use the ConstantLine.ShowBehind property. Note that this property does not affect the position of the constant line’s title.
| ShowBehind = False | ShowBehind = True |
|---|---|
 |
 |
You can display a constant line’s titles in both the diagram and the legend.
- Set the ConstantLine.ShowInLegend property to
trueand specify the description text in the ConstantLine.LegendText property to display a constant line’s description in a chart legend. - To display a title adjacent to a constant line, enable its TitleBase.Visible property, and specify its Title.Text property. To adjust the title’s position, use the ConstantLineTitle.Alignment and ConstantLineTitle.ShowBelowLine properties. The title appearance is defined by its TitleBase.TextColor, TitleBase.EnableAntialiasing and TitleBase.Font properties.
You can also specify various appearance options for a constant line such as color, dash style and line thickness. See the corresponding property descriptions for details.
Use the ConstantLine.Visible property to hide a constant line while maintaining it in an axis collection.