Strips
- 3 minutes to read
This topic describes how to display strips across axes, and customize strip appearance. Before you proceed with this section, you may wish to review the following help topic on axis fundamentals: Axes.
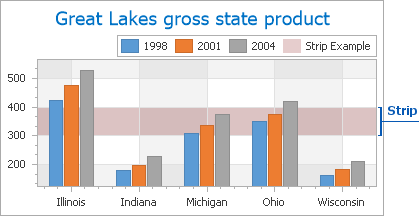
Strips are the highlighted areas in a chart’s diagram - within a defined axis value range (minimum and maximum). Strips are generally used to display a range of values for a series - to trace whether the series point values fall in or out of that range.
The following image displays a strip.
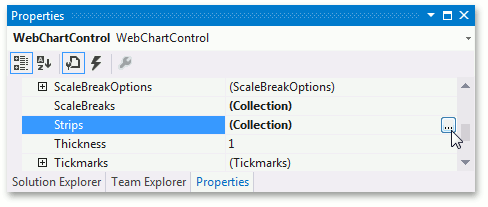
Strips belong to an axis object. You can add multiple strips to an axis’ corresponding collection. To access this collection, use the Axis2D.Strips property.
To create a strip and add it to an axis at design time, locate the axis in the Properties window, and click the ellipsis button for the Axis2D.Strips property.
This invokes the Strip Collection Editor.
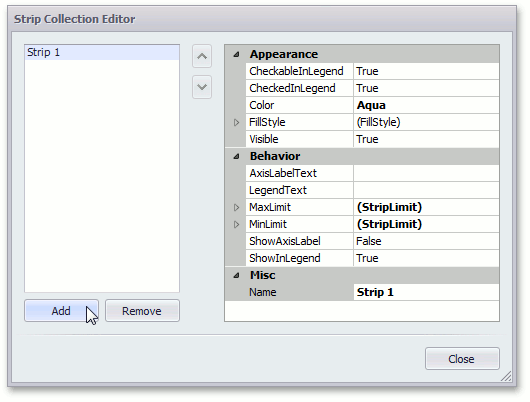
Click Add to create a strip, and define its properties.
The most important properties of a strip are the Strip.MinLimit and Strip.MaxLimit properties. These properties define the range of values within which the strip should be drawn. To enable these limits, set their StripLimit.Enabled properties to true.
If the StripLimit.Enabled property of the minimum limit is disabled, the strip will occupy the entire range below the maximum limit. Conversely, if the maximum limit’s property is disabled, the strip will occupy the range above the minimum limit. If the StripLimit.Enabled properties of both limits are disabled, the strip will occupy the entire axis value range.
Then, define the StripLimit.AxisValue properties of the strip’s limits. These property values should be defined in the appropriate measurement unit based on the current axis. To learn more, refer to the following help topic: Axis Scale Types.
Note
The strip’s minimum limit must be less than the maximum limit; otherwise, an error message is displayed.
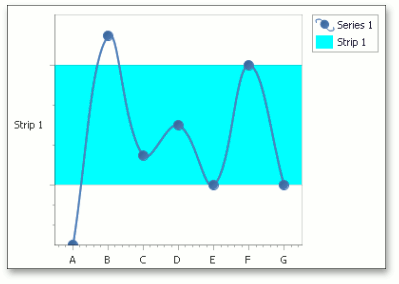
In addition, it is possible to show the strip’s description in the chart’s legend, and as a distinct axis label. To do this, enable the Strip.ShowInLegend and Strip.ShowAxisLabel properties accordingly. You can use the Strip.LegendText and Strip.AxisLabelText properties to define the description text independently from the strip’s ChartElementNamed.Name.
Strip appearance is determined by the Strip.Color and Strip.FillStyle properties.
You can disable the strip’s Strip.Visible property to hide a strip without removing it from the axis collection.