Primary and Secondary Axes
- 4 minutes to read
This topic describes the difference between primary and secondary axes, and how secondary axes can be created and assigned to a series. Before you proceed, you may wish to review the following help topic: Axes Overview.
The topic consists of the following sections.
Understanding Primary and Secondary Axes
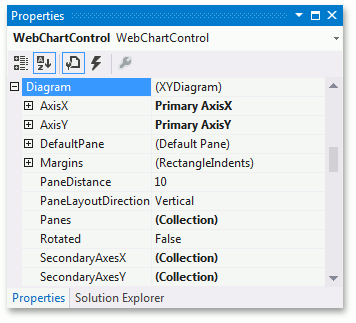
A chart’s diagram contains two primary axes - the axis of arguments (X-axis) and the axis of values (Y-axis). To access them at design time, expand the WebChartControl.Diagram property in the Properties window.
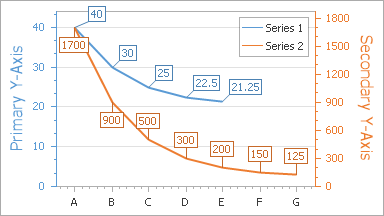
In a single chart, you can plot only one primary axis for each type (one X-axis and one Y-axis). If a single axis is not sufficient, you may require a secondary axis. The most common diagram type - the XY-Diagram 2D - supports secondary axes. Secondary axes may be required if, for example, you need to display series of a significantly different range of values, or series with entirely different arguments (or values), within a single diagram.
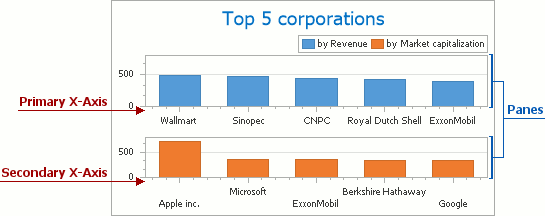
Another common scenario when secondary axes are useful is when series are distributed among multiple panes. In this instance, plot the primary axis across all panes, and create a secondary axis for each additional pane. For more information, refer to the following help topic: Panes Overview.
A key difference between primary and secondary axes is that you can have only one primary axis, but you can create an unlimited number of secondary axes.
Another notable difference between primary and secondary axes concerns axis alignment. The Axis2D.Alignment property can only be set to AxisAlignment.Zero for primary axes. To learn more, refer to the following help topic: Axis Appearance and Position.
Primary and secondary axes are similar in other aspects. Their appearance and layout can be customized in the same way, and they can have similar additional elements (such as grid lines, constant lines and titles). For general information about axis customization, refer to the following help topic: Axes.
Add Secondary Axes
The simplest way to create a secondary axis and assign it to a series is to use the Series Collection Editor. To customize the secondary axis, do the following.
- In the Properties window, click the Series… ellipsis button to invoke the Series Collection Editor.
- In the Series Collection Editor, switch to the Properties tab and expand the series view.
- Then click the XYDiagramSeriesViewBase.AxisX (or XYDiagramSeriesViewBase.AxisY) combo box.
To add a new secondary axis to the diagram’s collection and assign it to this series, click New axis, as shown below.

The assigned secondary axis appears in the diagram.

Next, you can customize the secondary axis (e.g., replace it by setting its Axis2D.Alignment property to AxisAlignment.Far. Note that AxisAlignment.Near is the default setting.

If your chart’s diagram contains multiple panes, a secondary axis is automatically displayed in the pane associated with the series to which the secondary axis belongs. Refer to the following help topic to learn more: Panes Overview.

Secondary axes are stored in the diagram’s collections, returned by the XYDiagram.SecondaryAxesX and XYDiagram.SecondaryAxesY properties. To access these collections, expand the WebChartControl.Diagram property in the Properties window, and click the ellipsis button for the appropriate property.

The Secondary Axis Collection Editor is displayed.

In this dialog, you can use the corresponding buttons to add or remove collection items, and customize secondary axes as required. Note that primary and secondary axes have the same available properties. To learn more, refer to the following help topics:
To quit the dialog and apply the changes, click Close.