Manhattan Bar Chart
- 3 minutes to read
Short Description
A ManhattanBarSeriesView object is used to display the Manhattan Bar Chart. This chart type belongs to the Bar and Column Series View type. This view allows you to display series of individual bars, grouped by category. The height of each bar is determined by the series value.
A Manhattan Bar chart is shown in the image below.
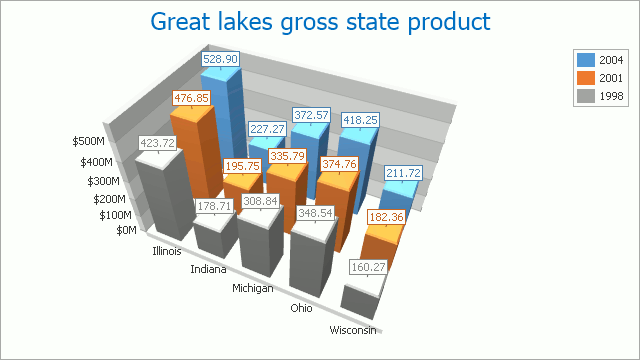
Chart Type Characteristics
The table below lists the main characteristics of this chart type.
| Feature | Value |
|---|---|
| Series View type | ManhattanBarSeriesView |
| Diagram type | XYDiagram3D |
| Number of arguments per series point | 1 |
| Number of values per series point | 1 |
Note
For information on which chart types can be combined with the Manhattan Bar Chart, refer to the following help topic: Combining Different Series Views.
Example
The following example creates a ChartControl with two series of the ManhattanBarSeriesView type, sets its general properties, and adds this chart to a form at runtime. Before proceeding with this example, first create a Windows Forms Application in Visual Studio, and add all required assemblies to the project’s References list.
Then, add the following code to the Form.Load event handler.
using System;
using System.Windows.Forms;
using DevExpress.XtraCharts;
// ...

private void Form1_Load(object sender, EventArgs e) {
    // Create a new chart.
    ChartControl ManhattanBarChart = new ChartControl();

    // Add a bar series to it.
    Series series1 = new Series("Series 1", ViewType.ManhattanBar);
    Series series2 = new Series("Series 2", ViewType.ManhattanBar);

    // Add points to the series.
    series1.Points.Add(new SeriesPoint("A", 10));
    series1.Points.Add(new SeriesPoint("B", 12));
    series1.Points.Add(new SeriesPoint("C", 14));
    series1.Points.Add(new SeriesPoint("D", 17));
    series2.Points.Add(new SeriesPoint("A", 5));
    series2.Points.Add(new SeriesPoint("B", 4));
    series2.Points.Add(new SeriesPoint("C", 10));
    series2.Points.Add(new SeriesPoint("D", 12));

    // Add both series to the chart.
    ManhattanBarChart.Series.AddRange(new Series[] { series1, series2 });

    // Access labels of the first series.
    ((BarSeriesLabel)series1.Label).Visible = true;
    ((BarSeriesLabel)series1.Label).ResolveOverlappingMode =
        ResolveOverlappingMode.Default;

    // Access the series options.
    series1.PointOptions.PointView = PointView.ArgumentAndValues;

    // Customize the view-type-specific properties of the series.
    Bar3DSeriesView myView = (Bar3DSeriesView)series2.View;
    myView.BarDepthAuto = false;
    myView.BarDepth = 1;
    myView.Transparency = 80;
    myView.ShowFacet = false;
    myView.Model = Bar3DModel.Cylinder;

    // Access the diagram's options.
    ((XYDiagram3D)ManhattanBarChart.Diagram).ZoomPercent = 110;

    // Add a title to the chart and hide the legend.
    ChartTitle chartTitle1 = new ChartTitle();
    chartTitle1.Text = "Manhattan Bar Chart";
    ManhattanBarChart.Titles.Add(chartTitle1);
    ManhattanBarChart.Legend.Visible = false;

    // Add the chart to the form.
    ManhattanBarChart.Dock = DockStyle.Fill;
    this.Controls.Add(ManhattanBarChart);
}