IntervalDateTimeScaleOptions.Pattern Property
Gets or sets a format string that configures text for the axis label and crosshair label.
Namespace: DevExpress.Xpf.Charts
Assembly: DevExpress.Xpf.Charts.v20.2.dll
NuGet Packages: DevExpress.WindowsDesktop.Wpf.Charts, DevExpress.Wpf.Charts
Declaration
Property Value
| Type | Description |
|---|---|
| String | A format string. |
Remarks
This pattern is applied when DateTimeScaleOptionsBase.GridLayoutMode is set to GridAndLabelCentered or GridShiftedLabelCentered. Otherwise, use the AxisLabel.TextPattern property.
Patterns can contain regular text (displayed as is) and value placeholders in braces. To format numeric and date/time values, you can apply Format Specifiers. Use a colon to separate a placeholder and its format specifier.
The following table contains the available placeholders:
| Placeholder | Description |
|---|---|
| {OB} | Displays an opening bracket. |
| {CB} | Displays a closing bracket. |
| {OS} | Displays the greater than sign. |
| {US} | Displays the less than or less than or equal to sign. |
| {A1} | Displays the interval start value. |
| {A2} | Displays the interval end value. |
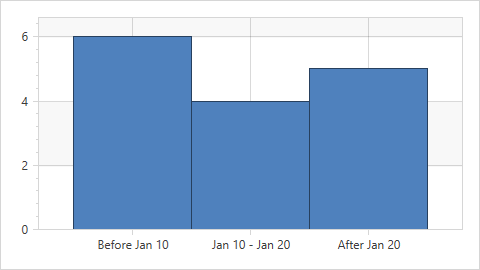
Example
This example demonstrates how to create a histogram chart based on date-time values.
Use the following API members to configure histogram options:
| Member | Description |
|---|---|
| IntervalDateTimeScaleOptions | Stores options for the date-time x-axis whose scale is divided into intervals. |
| ManualDateTimeScaleOptions.AggregateFunction | Gets or sets the function that is used to aggregate date-time axis data when one of the AxisX2D.DateTimeScaleOptions, AxisX3D.DateTimeScaleOptions, or RadarAxisX2D.DateTimeScaleOptions properties is set to ManualDateTimeScaleOptions. |
| OverflowValue | Gets or sets the overflow interval’s start value. |
| UnderflowValue | Gets or sets the underflow interval’s end value. |
Pattern |
Gets or sets a format string that configures text for the axis label and crosshair label. |
| OverflowValuePattern | Gets or sets a format string that configures text for the overflow interval axis label and crosshair label. |
| UnderflowValuePattern | Gets or sets a format string that configures text for the underflow interval axis label and crosshair label. |
<dxc:ChartControl x:Name="chartControl"
                  Width="480" Height="270">
    <dxc:XYDiagram2D>
        <dxc:XYDiagram2D.AxisX>
            <dxc:AxisX2D TickmarksMinorVisible="False"
                         GridLinesVisible="True">
                <dxc:AxisX2D.DateTimeScaleOptions>
                    <!-- Configure histogram options. -->
                    <dxc:IntervalDateTimeScaleOptions AggregateFunction="Histogram"
                                                      OverflowValue="2019/01/20"
                                                      UnderflowValue="2019/01/10"
                                                      Pattern="{}{A1:MMM dd} - {A2:MMM dd}"
                                                      OverflowValuePattern="After {A1: MMM dd}"
                                                      UnderflowValuePattern="Before {A2: MMM dd}"/>
                    <!--...-->
                </dxc:AxisX2D.DateTimeScaleOptions>
                <dxc:AxisX2D.WholeRange>
                    <dxc:Range SideMarginsValue="0.8" AutoSideMargins="False"/>
                </dxc:AxisX2D.WholeRange>
            </dxc:AxisX2D>
        </dxc:XYDiagram2D.AxisX>
        <dxc:BarSideBySideSeries2D  DisplayName="Series"
                                    DataSource="{Binding}"
                                    ArgumentDataMember="Date"
                                    ArgumentScaleType="DateTime"
                                    BarWidth="1">
        </dxc:BarSideBySideSeries2D>
    </dxc:XYDiagram2D>
</dxc:ChartControl>