ManualTimeSpanScaleOptions Class
Contains settings for a time-span axis when its scale mode is manual. This scale mode allows you to specify a measurement unit.
Namespace: DevExpress.Xpf.Charts
Assembly: DevExpress.Xpf.Charts.v20.2.dll
NuGet Packages: DevExpress.WindowsDesktop.Wpf.Charts, DevExpress.Wpf.Charts
Declaration
Remarks
You can use an ManualTimeSpanScaleOptions object to specify the following properties:
- ArgumentAxis3D.TimeSpanScaleOptions
- AxisX2D.TimeSpanScaleOptions
- AxisX3D.TimeSpanScaleOptions
- RadarAxisX2D.TimeSpanScaleOptions
When an x-axis scale is manual, you can aggregate data based on a given MeasureUnit.
To form a custom measurement unit, use MeasureUnitMultiplier. For instance, by setting the MeasureUnit to Hour and the MeasureUnitMultiplier to 3, you configure a measurement unit of three hours.
Use the AggregateFunction property to define an arithmetic operation used to aggregate points. The default function is Average. The AggregateFunction enum lists all the available functions. If predefined functions do not meet your requirements, set AggregateFunction to Custom and use the CustomAggregateFunction property to set a custom function object.
The following options allows you to fine-tune grid parameters that affect the position of grid lines, tick marks and axis labels.
The grid alignment and grid spacing are automatically calculated when the AutoGrid property is enabled.
Example
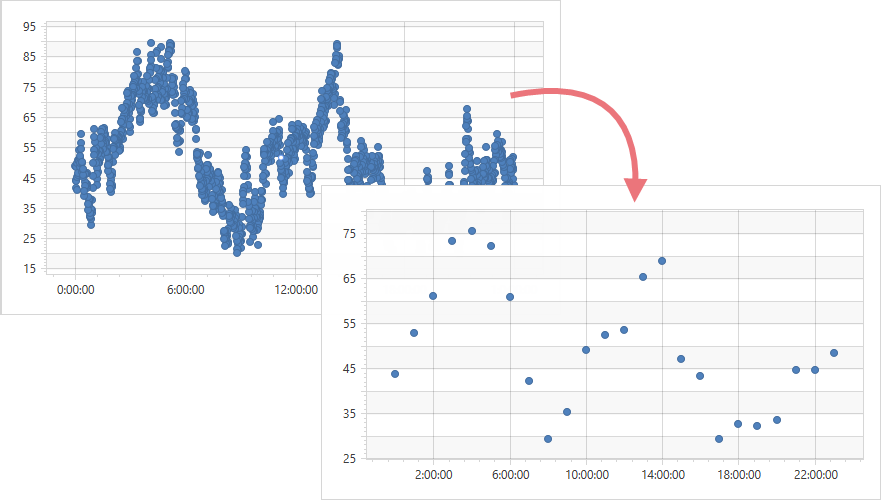
The following example shows how to group minute-by-minute data into data points with a greater measurement unit (“Hour”).
- Use the ManualTimeSpanScaleOptions.MeasureUnit property to specify the measurement unit that should be greater than the initial data measurement unit.
To change an arithmetic function used for computing point aggregates, use ManualTimeSpanScaleOptions.AggregateFunction.
Optionally, you can specify the ManualTimeSpanScaleOptions.GridAlignment, ManualTimeSpanScaleOptions.GridSpacing, and ManualTimeSpanScaleOptions.GridOffset properties.
<Window
        xmlns="http://schemas.microsoft.com/winfx/2006/xaml/presentation"
        xmlns:x="http://schemas.microsoft.com/winfx/2006/xaml"
        xmlns:d="http://schemas.microsoft.com/expression/blend/2008"
        xmlns:mc="http://schemas.openxmlformats.org/markup-compatibility/2006"
        xmlns:local="clr-namespace:TimeSpanExample"
        xmlns:dxc="http://schemas.devexpress.com/winfx/2008/xaml/charts"
        x:Class="TimeSpanExample.MainWindow"
        mc:Ignorable="d"
        Title="MainWindow" Height="450" Width="800">
    <Window.DataContext>
        <local:ChartViewModel/>
    </Window.DataContext>
    <Grid>
        <dxc:ChartControl>
            <dxc:XYDiagram2D>
                <dxc:XYDiagram2D.AxisX>
                    <dxc:AxisX2D>
                        <dxc:AxisX2D.TimeSpanScaleOptions>
                            <dxc:ManualTimeSpanScaleOptions GridAlignment="Hour"
                                                            GridSpacing="4"
                                                            MeasureUnit="Hour"
                                                            AggregateFunction="Average"
                                                            GridOffset="2"
                                                            AutoGrid="False"/>
                        </dxc:AxisX2D.TimeSpanScaleOptions>
                    </dxc:AxisX2D>
                </dxc:XYDiagram2D.AxisX>
                <!-- Other diagram settings. -->
            </dxc:XYDiagram2D>
        </dxc:ChartControl>
    </Grid>
</Window>