RangeColorizer3D Class
Colorizer that colors all points by values.
Namespace: DevExpress.Xpf.Charts
Assembly: DevExpress.Xpf.Charts.v20.2.dll
NuGet Packages: DevExpress.WindowsDesktop.Wpf.Charts, DevExpress.Wpf.Charts
Declaration
Remarks
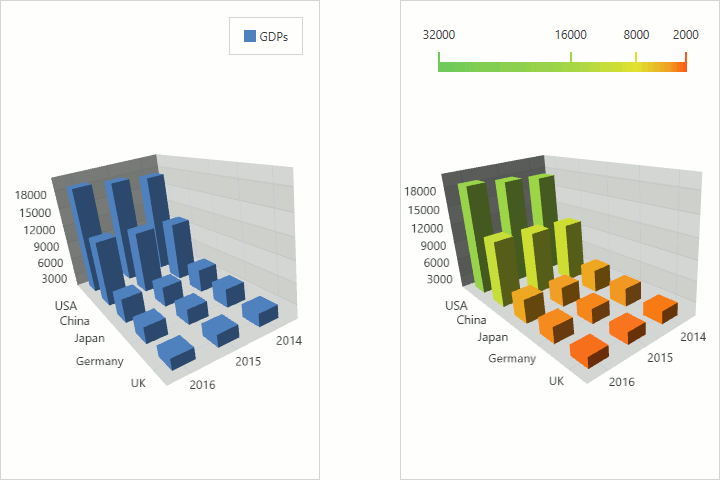
The following image demonstrates 3D bars colored using this colorizer.
Use the following properties to configure the RangeColorizer3D:
- Add double values to the RangeStops collection to define color range boundaries.
- The ApproximateColors property allows you to enable color approximation.
- The ValueProvider property specifies a point value the colorizer should use to define the point color. If this property is not specified, the colorizer paints the chart based on values that the ValueDataMember property provides. To make the colorizer use the ColorDataMember‘s (Series3DDataSourceAdapter.ColorDataMember or SeriesPoint3DDataSourceAdapter.ColorDataMember) values to calculate chart colors, assign a ColorObjectValueProvider3D instance to the ValueDataMember.
Example
This example demonstrates how to colorize series point markers based on range values. To do this, assign a RangeColorizer3D object to the Series3DViewBase.Colorizer property. Then, configure range stops using the RangeColorizer3D.RangeStops property and optionally, configure required colors using the PaletteColorizer3DBase.Palette property.
<Window xmlns="http://schemas.microsoft.com/winfx/2006/xaml/presentation"
        xmlns:x="http://schemas.microsoft.com/winfx/2006/xaml"
        xmlns:d="http://schemas.microsoft.com/expression/blend/2008"
        xmlns:mc="http://schemas.openxmlformats.org/markup-compatibility/2006"
        xmlns:view="clr-namespace:RangeColorizer3DExample"
        xmlns:viewModel="clr-namespace:RangeColorizer3DExample.ViewModel"
        xmlns:dxc="http://schemas.devexpress.com/winfx/2008/xaml/charts"
        x:Class="RangeColorizer3DExample.MainWindow"
        mc:Ignorable="d"
        Title="MainWindow"
        Height="309"
        Width="496">
    <Window.DataContext>
        <viewModel:GdpViewModel />
    </Window.DataContext>
    <Grid>

        <dxc:Chart3DControl AspectRatio="5,3,3"
                            Padding="0">
            <dxc:Chart3DControl.Legends>
                <dxc:Legend HorizontalPosition="Right"
                            VerticalPosition="Top"
                            Orientation="Horizontal"/>
            </dxc:Chart3DControl.Legends>
            <dxc:Series3DStorage>
                <!--region #Series-->
                <dxc:Series3D DisplayName="Gdps"
                              YArgumentScaleType="Qualitative">
                    <dxc:Series3D.View>
                        <dxc:Bar3DSeriesView>
                            <dxc:Bar3DSeriesView.Colorizer>
                                <dxc:RangeColorizer3D ApproximateColors="True"
                                                      RangeStops="2000 4000 8000 16000 32000">
                                    <dxc:RangeColorizer3D.Palette>
                                        <dxc:CustomPalette>
                                            <dxc:CustomPalette.Colors>
                                                <Color>#FD5915</Color>
                                                <Color>#F09D25</Color>
                                                <Color>#E2E232</Color>
                                                <Color>#A5D648</Color>
                                                <Color>#6EC95C</Color>
                                            </dxc:CustomPalette.Colors>
                                        </dxc:CustomPalette>
                                    </dxc:RangeColorizer3D.Palette>
                                </dxc:RangeColorizer3D>
                            </dxc:Bar3DSeriesView.Colorizer>
                            <dxc:Bar3DSeriesView.BarModel>
                                <dxc:Bar3DBoxPointModel ShowFacets="False" />
                            </dxc:Bar3DSeriesView.BarModel>
                        </dxc:Bar3DSeriesView>
                    </dxc:Series3D.View>
                    <dxc:SeriesPoint3DDataSourceAdapter DataSource="{Binding Path=Gdps}"
                                                        XArgumentDataMember="Country"
                                                        YArgumentDataMember="Year"
                                                        ValueDataMember="Value"/>
                </dxc:Series3D>
                <!--endregion #Series-->
            </dxc:Series3DStorage>
        </dxc:Chart3DControl>

    </Grid>
</Window>
Inheritance
See Also