FunnelSeries2D Class
Represents a series view of the Funnel type.
Namespace: DevExpress.Xpf.Charts
Assembly: DevExpress.Xpf.Charts.v20.2.dll
NuGet Packages: DevExpress.WindowsDesktop.Wpf.Charts, DevExpress.Wpf.Charts
Declaration
Remarks
The FunnelSeries2D class provides the functionality of a series view of the Funnel Series type within a chart control.
In addition to the common view settings inherited from the base Series class, the FunnelSeries2D class declares the funnel type specific settings, which allow you to enable the auto-calculation of a funnel’s height-to-width ratio (the FunnelSeries2D.HeightToWidthRatio, and FunnelSeries2D.HeightToWidthRatioAuto properties), to control a funnel’s alignment with respect to the position of its labels (the FunnelSeries2D.AlignToCenter property), and a funnel’s appearance (the FunnelSeries2D.Border and FunnelSeries2D.ActualBorder properties).
For more information, refer to Funnel Series.
Example
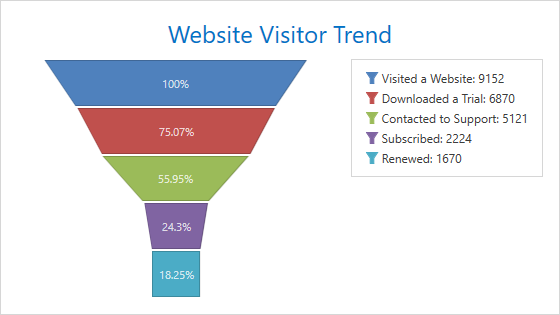
This example demonstrates how to create a 2D Funnel chart.
Create a ChartControl and set its ChartControl.Diagram property to a SimpleDiagram2D object.
Note
Note that the ChartControl.Diagram is a content property. You can declare a diagram in XAML directly after a chart control’s declaration without wrapping it in opening and closing ChartControl.Diagram tags.
Add a
FunnelSeries2Dobject to the Diagram.Series collection.Note
Note that the Diagram.Series is a content property. You can declare series in XAML directly after a diagram’s declaration without wrapping them in opening and closing Diagram.Series tags.
Use the following properties to bind the series to data:
- Series.DataSource - Specifies the series’s data source.
- Series.ArgumentDataMember - Defines the data member that provides the series’s arguments.
- Series.ValueDataMember - Specifies the data member that provides the series’s values.
Set the Series.LegendTextPattern property to “{}{A}: {V}” to show a point argument with a corresponding value for each point in the legend.
Enable the Series.LabelsVisibility property to display the series labels. Set the SeriesLabel.TextPattern property to “{}{VP:##.##%}” to show a point’s percentage value in each series label.
To change the funnel height’s ratio to its width, disable the FunnelSeries2D.HeightToWidthRatioAuto property and define FunnelSeries2D.HeightToWidthRatio.
You can optionally add a chart title and change the legend‘s position.
<Window
        xmlns="http://schemas.microsoft.com/winfx/2006/xaml/presentation"
        xmlns:x="http://schemas.microsoft.com/winfx/2006/xaml"
        xmlns:dxc="http://schemas.devexpress.com/winfx/2008/xaml/charts"
        xmlns:local="clr-namespace:FunnelChart"
        x:Class="FunnelChart.MainWindow"
        Title="MainWindow" Height="650" Width="900">
    <Window.DataContext>
        <local:ChartViewModel/>
    </Window.DataContext>
    <Grid>
        <dxc:ChartControl>
            <dxc:SimpleDiagram2D>
                <dxc:FunnelSeries2D DataSource="{Binding Data}"
                                    ArgumentDataMember="Argument"
                                    ValueDataMember="Value"
                                    LegendTextPattern="{}{A}: {V}"
                                    HeightToWidthRatioAuto="False"
                                    HeightToWidthRatio="0.9"
                                    PointDistance="2"
                                    LabelsVisibility="True">
                    <dxc:FunnelSeries2D.Label>
                        <dxc:SeriesLabel TextPattern="{}{VP:##.##%}"
                                         dxc:FunnelSeries2D.LabelPosition="Center"/>
                    </dxc:FunnelSeries2D.Label>
                </dxc:FunnelSeries2D>
            </dxc:SimpleDiagram2D>
            <dxc:ChartControl.Titles>
                <dxc:Title Content="Website Visitor Trend"
                           Dock="Top"
                           HorizontalAlignment="Center"/>
            </dxc:ChartControl.Titles>
            <dxc:ChartControl.Legends>
                <dxc:Legend HorizontalPosition="RightOutside"
                            VerticalPosition="Top"/>
            </dxc:ChartControl.Legends>
        </dxc:ChartControl>
    </Grid>
</Window>