IntervalNumericScaleOptions Class
The options that provide means to create axis intervals whose number and width are calculated automatically.
Namespace: DevExpress.Xpf.Charts
Assembly: DevExpress.Xpf.Charts.v20.2.dll
NuGet Packages: DevExpress.WindowsDesktop.Wpf.Charts, DevExpress.Wpf.Charts
Declaration
Example
This example demonstrates how to create a histogram chart.
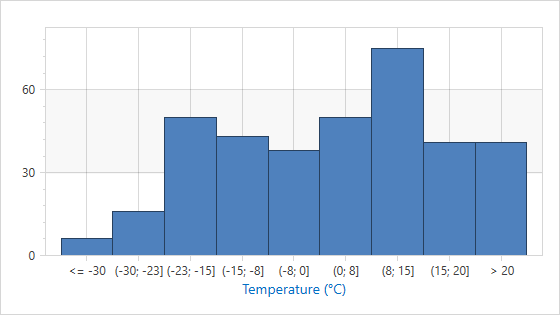
The code below configures a histogram for a chart with a numeric x-axis scale.
<dxc:ChartControl x:Name="chartControl">
    <dxc:XYDiagram2D>
        <dxc:XYDiagram2D.AxisX>
            <dxc:AxisX2D TickmarksMinorVisible="False"
                         GridLinesVisible="True">
                <dxc:AxisX2D.NumericScaleOptions>
                    <!-- Configure a histogram with the specified number of bins. -->
                    <dxc:IntervalNumericScaleOptions AggregateFunction="Histogram"
                                                     OverflowValue="20"
                                                     UnderflowValue="-30"
                                                     GridLayoutMode="GridAndLabelCentered"
                                                     Pattern="{}{OB}{A1:F0}; {A2:F0}{CB}"
                                                     OverflowValuePattern="{}{OS} {A1:F0}"
                                                     UnderflowValuePattern="{}{US} {A2:F0}"/>
                    <!--...-->
                </dxc:AxisX2D.NumericScaleOptions>
                <dxc:AxisX2D.WholeRange>
                    <dxc:Range SideMarginsValue="0.8"/>
                </dxc:AxisX2D.WholeRange>
                <dxc:AxisX2D.Title>
                    <dxc:AxisTitle Content="Temperature (°C)" FontSize="14" Margin="0" Padding="0"/>
                </dxc:AxisX2D.Title>
            </dxc:AxisX2D>
        </dxc:XYDiagram2D.AxisX>
        <dxc:BarSideBySideSeries2D  DisplayName="Temperature"
                                    DataSource="{Binding}"
                                    ArgumentDataMember="Temperature"
                                    BarWidth="1">
        </dxc:BarSideBySideSeries2D>
    </dxc:XYDiagram2D>
</dxc:ChartControl>
The following API members configure the histogram options:
| Member | Description |
|---|---|
IntervalNumericScaleOptions |
The options that provide means to create axis intervals whose number and width are calculated automatically. |
| ManualNumericScaleOptions.AggregateFunction | Gets or sets the function that is used to aggregate numeric axis data when one of the AxisX2D.NumericScaleOptions, AxisX3D.NumericScaleOptions, or CircularAxisX2D.NumericScaleOptions properties is set to ManualNumericScaleOptions. |
| WidthIntervalNumericScaleOptions.Width | Gets or sets the interval width in x-axis measurement units. |
| IntervalNumericScaleOptions.OverflowValue | Gets or sets the start value for the interval that includes overflow values. |
| IntervalNumericScaleOptions.UnderflowValue | Gets or sets the end value for the interval that includes underflow values. |
| IntervalNumericScaleOptions.GridLayoutMode | Gets or sets the value that specifies the alignment of grid lines, major tickmarks and axis labels. |
| IntervalNumericScaleOptions.Pattern | Gets or sets a format string that configures text for the interval axis labels and crosshair labels. |
| IntervalNumericScaleOptions.OverflowValuePattern | Gets or sets a format string that configures text for the overflow interval axis labels and crosshair labels. |
| IntervalNumericScaleOptions.UnderflowValuePattern | Gets or sets a format string that configures text for the underflow interval axis labels and crosshair labels. |
Inheritance
See Also