Crosshair Cursor
- 3 minutes to read
The crosshair cursor provides a great level of interactivity by allowing you to track series point coordinates on a chart. It is also used for analyzing data when you need to compare different graphs.
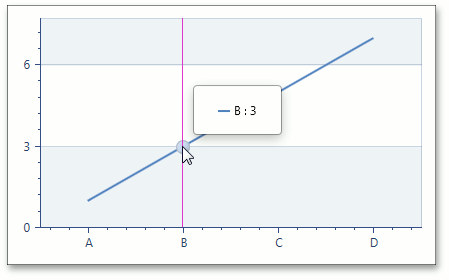
The crosshair cursor is represented by a pair of intersecting horizontal and vertical lines (the value line and the argument line) with the corresponding axis labels (the value labels and the argument labels) at the end of the lines. The crosshair argument line is visible only by default.
See the Crosshair Cursor Customization section to learn how to show the entire crosshair cursor on a chart.
A cursor also contains a label (the crosshair label) that is positioned on the lines’ intersection. This label shows the current series point argument and value by default.
Note
When you hover over a series point using either a mouse or your finger, it is highlighted automatically, thanks to the CrosshairOptions.HighlightPoints property (which is set to true by default).
To support series points highlighting, series point markers are hidden by default. To display markers on a diagram, set the MarkerVisible property for a particular series to true (e.g., LineSeries2D.MarkerVisible).
When your chart contains two or more series, the crosshair cursor label has the following appearance:
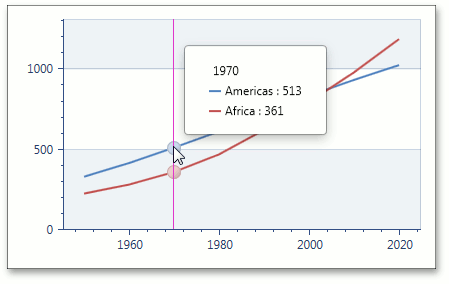
As you can see, each crosshair label contains a group header that helps to operate with numerous data. If you wish to hide the group header, set the CrosshairOptions.ShowGroupHeaders property to false.
Note
If a series name is not displayed on a crosshair label, you need to specify it using the Series.DisplayName property.
A crosshair cursor is enabled by default. This means that you do not need to write any code to add it to a chart. If you wish to deactivate a crosshair cursor, you can do one of the following:
- Use the ChartControlBase.CrosshairEnabled property to disable/enable a crosshair cursor at the chart control level;
- Use the XYSeries2D.CrosshairEnabled property to disable/enable a crosshair cursor for a specific series.
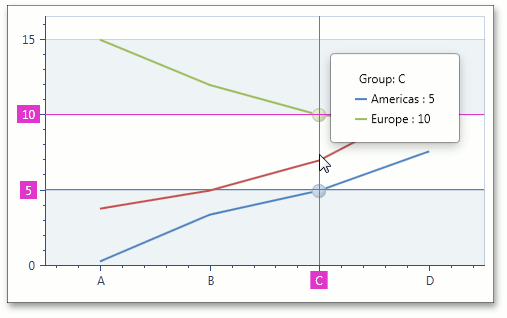
The following image illustrates the second approach to enabling a crosshair cursor for two line series only.
Note
In the image above, group headers of the crosshair cursor were formatted using the CrosshairOptions.GroupHeaderPattern property set to the “Group: {A}” value. See the Crosshair Cursor Customization section to learn more.
In addition, you can show the Crosshair cursor programmatically, using the XYDiagram2D.ShowCrosshair method. For example, the following code demonstrates how to show the Cursor programmatically on the Mouse.MouseUp attached event of the Chart Control.
private void OnChartControlMouseUp(object sender, MouseButtonEventArgs e) {
    XYDiagram2D xyDiagram = chartControl.Diagram as XYDiagram2D;
    if (xyDiagram == null) return;

    xyDiagram.ShowCrosshair(e.GetPosition(chartControl));
}
Finally, if you need an alternative tool to operate with data, you can use tooltips.
See the Tooltip topic to learn more.