Chart.DataTable Property
Gets or sets data table options for the chart.
Namespace: DevExpress.Docs.Presentation
Assembly: DevExpress.Docs.Presentation.v26.1.dll
Declaration
Property Value
| Type | Description |
|---|---|
| DataTableOptions | Data table options for the chart. |
Remarks
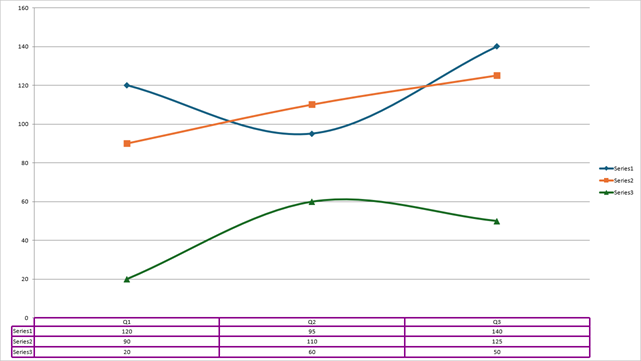
The following code snippet creates a chart with a data table, adds a series, and specifies the series data:
using DevExpress.Docs.Office;
using DevExpress.Docs.Presentation;
using System.Drawing;

namespace PresentationApiSample;

public class Program {
    public static async Task Main(string[] _) {

        Presentation presentation = new Presentation();

        presentation.Slides.Clear();

        Slide slide = new Slide(SlideLayoutType.Blank);
        presentation.Slides.Add(slide);

        // Insert a chart that fills the slide.
        Chart chart = new Chart();
        chart.Width = presentation.SlideSize.Width;
        chart.Height = presentation.SlideSize.Height;
        slide.Shapes.Add(chart);

        // Populate chart data.
        chart.Data[0, "A1"].NumericValue = 120;
        chart.Data[0, "A2"].NumericValue = 95;
        chart.Data[0, "A3"].NumericValue = 140;

        chart.Data[0, "B1"].TextValue = "Q1";
        chart.Data[0, "B2"].TextValue = "Q2";
        chart.Data[0, "B3"].TextValue = "Q3";

        chart.Data[0, "C1"].NumericValue = 90;
        chart.Data[0, "C2"].NumericValue = 110;
        chart.Data[0, "C3"].NumericValue = 125;

        chart.Data[0, "D1"].NumericValue = 20;
        chart.Data[0, "D2"].NumericValue = 60;
        chart.Data[0, "D3"].NumericValue = 50;

        // Add the first series and specify its data source.
        LineSeries series = new LineSeries();
        series.Values = new ChartDataReference(sheetIndex: 0, fromCellReference: "A1", toCellReference: "A3");
        series.Arguments = new ChartDataReference(sheetIndex: 0, fromCellReference: "B1", toCellReference: "B3");
        chart.Series.Add(series);

        // Add the second series and specify its data source.
        LineSeries series1 = new LineSeries();
        series1.Values = new ChartDataReference(sheetIndex: 0, fromCellReference: "C1", toCellReference: "C3");
        series1.Arguments = new ChartDataReference(sheetIndex: 0, fromCellReference: "B1", toCellReference: "B3");
        chart.Series.Add(series1);

        // Add the third series and specify its data source.
        LineSeries series2 = new LineSeries();
        series2.Values = new ChartDataReference(sheetIndex: 0, fromCellReference: "D1", toCellReference: "D3");
        series2.Arguments = new ChartDataReference(sheetIndex: 0, fromCellReference: "B1", toCellReference: "B3");
        chart.Series.Add(series2);

        // Add a data table and specify its options.
        chart.DataTable = new DataTableOptions {
            ShowHorizontalBorder = true,
            ShowVerticalBorder = true,
            OutlineStyle = new OutlineStyle { Fill = new SolidFill(Color.DarkMagenta), Width = 10 },
            ShowOutline = true,
        };
    }
}
See Also