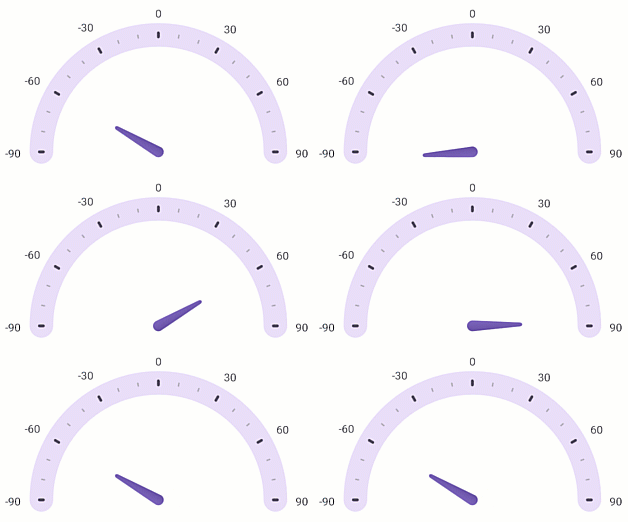
Indicators
- 2 minutes to read
This topic lists different visual indicators you can add to a gauge scale and explains how to customize indicator appearance.
Add Value Indicators to a Scale and Customize Their Appearance
You can add different indicators to mark a value or a value range on a scale. A scale can contain any number of indicators. The following indicators are available:
- MarkerIndicator
- Set a marker indicator’s Value property to mark a value on the scale.
- NeedleIndicator
- Set a needle indicator’s Value to specify a value on the scale on which the needle points.
- RangeIndicator
- Set a range indicator’s StartValue and EndValue properties to specify a range of values to be highlighted on the scale.
The following markup adds value indicators to a scale and customizes their settings:

<dx:RadialGauge>
    <dx:RadialScale ...
                    Fill="LightGray" Thickness="30">
        <dx:MarkerIndicator Value="45" Position="Outside"
                    Thickness="4" Size="20" Fill="#FF7F50" Offset="10"/>
        <dx:NeedleIndicator Value="130"
                    Fill="#FF7F50"
                    Size="80" Thickness="4"/>
        <dx:RangeIndicator StartValue="70" EndValue="110"
                    StartThickness="20"
                    EndThickness="90"
                    Offset="-2">
            <dx:RangeIndicator.Fill>
                <RadialGradientBrush Center="0.5,0.5">
                    <GradientStop Color="#E9E9E9" Offset="0.6"/>
                    <GradientStop Color="#575757" Offset="0.85"/>
                </RadialGradientBrush>
            </dx:RangeIndicator.Fill>
        </dx:RangeIndicator>
    </dx:RadialScale>
</dx:RadialGauge>
Custom Draw Indicators
You can handle the IndicatorBase<T>.CustomDraw event to draw a custom indicator based on a predefined type.
The following example shows how to draw a custom marker indicator:

<dx:MarkerIndicator Value="0.6"
                    CustomDraw="MarkerIndicatorCustomDraw"
                    Offset="5" Size="20"
                    RadialScaleElementPosition="Inside"/>
using SkiaSharp;
using SkiaSharp.Views.Maui;
//...
private void MarkerIndicatorCustomDraw(object sender, DevExpress.Maui.Gauges.CustomDrawIndicatorEventArgs e) {
    e.Paint = new SKPaint {
        Color = Color.FromArgb("#2D67D0").ToSKColor(),
        IsStroke = false,
    };
    SKPath path = SKPath.ParseSvgPathData("M17.9 4.2C17.3334 3.44458 16.4443 3 15.5 3H4.5C2.84315 3 1.5 4.34315 1.5 6V18C1.5 19.6569 2.84315 21 4.5 21H15.5C16.4443 21 17.3334 20.5554 17.9 19.8L22.4 13.8C23.2 12.7333 23.2 11.2667 22.4 10.2L17.9 4.2Z");
    SKMatrix scale = SKMatrix.CreateScale(1f / 24f, 1f / 24f);
    path.Transform(scale);
    e.Path = path;
}
Animate Indicators
You can apply different animation effects to the value indicator when the Value property changes. Enable an indicator’s AllowAnimation property. You can use the IndicatorBase.AnimationDuration property to set the animation progress time.
Specify the IndicatorBase.AnimationEasing property to define how the indicator animation speeds up or slows down. The following easing functions are available:
- BackEasingFunction
- BounceEasingFunction
- CircleEasingFunction
- CubicEasingFunction
- ElasticEasingFunction
- ExponentialEasingFunction
- LinearEasingFunction
- PowerEasingFunction
- QuadraticEasingFunction
- QuarticEasingFunction
- QuinticEasingFunction
- SineEasingFunction
The following example applies animation effects to a gauge:

<ContentPage ...
             xmlns:dx="http://schemas.devexpress.com/maui">
             <!--...-->
<dx:RadialScale ...>
    <dx:NeedleIndicator ...
                        AllowAnimation="True"
                        AnimationDuration="0:0:1">
        <dx:NeedleIndicator.AnimationEasing>
            <dx:BackEasingFunction EasingMode="In"/>
        </dx:NeedleIndicator.AnimationEasing>
    </dx:NeedleIndicator>
</dx:RadialScale>