Diagram Overview
- 4 minutes to read
This topic explains how to use the ASP.NET Chart Control’s diagram, including its purpose, implementation and features. Before you proceed with this topic, you may wish to review the fundamental chart concepts in the following help topic: Charting Basics.
The topic consists of the following sections.
Main Concepts
Similar to a series, a chart title or a legend, a diagram is one of the most basic chart elements. Architecturally, the diagram is a parent element for a chart’s panes and axes, and visually - it encloses a chart’s series. Although series do not formally belong to the Diagram object (they instead reside in the WebChartControl’s SeriesCollection), they are dependent upon this diagram type, and displayed within the diagram’s boundaries. Refer to the following help topic to view the structure of ASP.NET Chart Control elements: Chart Elements.

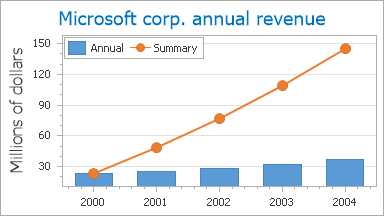
You can plot multiple panes only within the same diagram (of the XY-Diagram type), as shown in the image above. For details, refer to the following help topic: Panes Overview.
A diagram’s most significant characteristic is its type. A diagram’s type depends on the view type of the chart’s series. By default, it is automatically determined by the view type of the first visible series in the chart’s collection. Note that the Diagram object is equal to null (Nothing in Visual Basic) until a chart has at least one series in its collection.
So, a diagram of each type can only display series of the appropriate view types. And, it is impossible to plot multiple series of incompatible view types within the same Diagram object (and therefore, within the same chart). To learn more on this, refer to Combining Different Series Views.
In addition, for each diagram type there is a unique set of available options and elements.
In the following list, the available diagram types are broken into several basic categories. For specific details on each diagram type, refer to the appropriate document.
| Simple Diagram | Simple Diagram 3D |
|---|---|
 |
 |
| XY-Diagram | XY-Diagram 3D |
 |
 |
| Gantt Diagram | Funnel Diagram 3D |
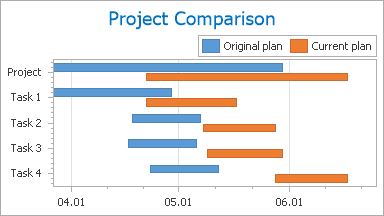 |
 |
| Radar and Polar Diagrams | Swift Plot Diagram |
 |
 |
To access almost any of the chart’s elements (excepting its series, titles and legend), you should first access the diagram itself. How this is done (both at design and runtime), is briefly described in the following section of this document: Accessing the Diagram.
Accessing the Diagram
To access the diagram at design time, click your chart control, to select it. Then, in the Properties window, locate the WebChartControl.Diagram property, and expand it. You will see the list of available properties for this diagram type. Note that the set of these properties is dependent upon the diagram’s type.

At runtime, a diagram is represented by an instance of the Diagram class, which can be accessed via the WebChartControl.Diagram property. To access a diagram’s elements and properties, you should cast your diagram’s instance to the specific diagram’s type, as the following example demonstrates.
// Create a new WebChartControl instance.
WebChartControl chartControl1= new WebChartControl();

// Create a series of a compatible view type,
// and add it to the chart's collection,
// so the diagram object shall not to be equal to null.
Series series1 = new Series("Line Series 1", ViewType.Line);
chart.Series.Add(series1);

// Access the chart's diagram properties, e.g. rotate the diagram.
((XYDiagram)chartControl1.Diagram).Rotated = true;

// Access properties of objects that belong to the diagram, e.g. axes and panes.
((XYDiagram)chartControl1.Diagram).AxisX.Color = Color.Red;
((XYDiagram)chartControl1.Diagram).Panes[0].BackColor = Color.Black;
Note that if the diagram type to which you cast your diagram object is not appropriate (e.g. it has series of incompatible view types), an exception will be thrown.