Step Line Chart
- 3 minutes to read
Short Description
The Step Line Chart is represented by the StepLine3DSeriesView object, which belongs to Point, Line and Spline Series Views. This view is useful when you need to show to what extent values have changed for different points in the same series. Also, you can set the StepLine3DSeriesView.InvertedStep property to true to specify whether these steps are shown as inverted or not.
A Step Line chart is shown in the image below.
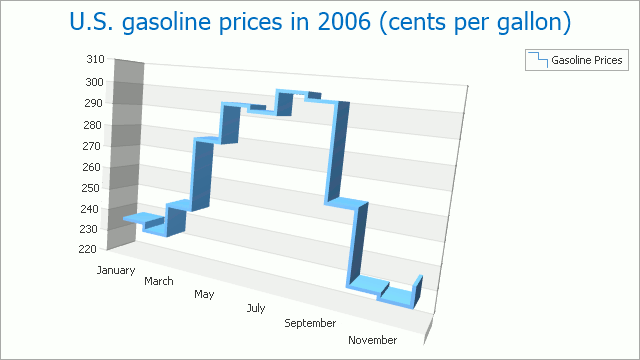
Chart Type Characteristics
The table below lists the main characteristics of this chart type.
| Feature | Value |
|---|---|
| Series View type | StepLine3DSeriesView |
| Diagram type | XYDiagram3D |
| Number of arguments per series point | 1 |
| Number of values per series point | 1 |
Note
For information on which chart types can be combined with the Step Line Chart, refer to the Combining Different Series Views document.
Example
The following example demonstrates how to create a ChartControl with a series of the StepLine3DSeriesView type, set its general properties, and add this chart to a form at runtime. Before proceeding with this example, first create a Windows Forms Application in Visual Studio, and include all necessary assemblies to the References list of your project.
Then, add the following code to the Form.Load event handler.
using System;
using System.Windows.Forms;
using DevExpress.XtraCharts;
// ...

private void Form1_Load(object sender, EventArgs e) {
    // Create a new chart.
    ChartControl StepLineChart3D = new ChartControl();

    // Add a step line series to it.
    Series series1 = new Series("Series 1", ViewType.StepLine3D);

    // Add points to the series.
    series1.Points.Add(new SeriesPoint("A", 12));
    series1.Points.Add(new SeriesPoint("B", 4));
    series1.Points.Add(new SeriesPoint("C", 17));
    series1.Points.Add(new SeriesPoint("D", 7));
    series1.Points.Add(new SeriesPoint("E", 12));
    series1.Points.Add(new SeriesPoint("F", 4));
    series1.Points.Add(new SeriesPoint("G", 17));
    series1.Points.Add(new SeriesPoint("H", 7));

    // Add the series to the chart.
    StepLineChart3D.Series.Add(series1);

    // Access labels of the series.
    ((Line3DSeriesLabel)series1.Label).Visible = true;
    ((Line3DSeriesLabel)series1.Label).ResolveOverlappingMode =
        ResolveOverlappingMode.Default;

    // Access the series options.
    series1.PointOptions.PointView = PointView.ArgumentAndValues;

    // Customize the view-type-specific properties of the series.
    StepLine3DSeriesView myView = (StepLine3DSeriesView)series1.View;
    myView.LineWidth = 5;
    myView.LineThickness = 4;

    // Access the diagram's options.
    ((XYDiagram3D)StepLineChart3D.Diagram).RuntimeRotation = true;
    ((XYDiagram3D)StepLineChart3D.Diagram).RotationType =
        RotationType.UseMouseStandard;

    // Add a title to the chart and hide the legend.
    ChartTitle chartTitle1 = new ChartTitle();
    chartTitle1.Text = "3D Step Line Chart";
    StepLineChart3D.Titles.Add(chartTitle1);
    StepLineChart3D.Legend.Visible = false;

    // Add the chart to the form.
    StepLineChart3D.Dock = DockStyle.Fill;
    this.Controls.Add(StepLineChart3D);
}