Doughnut Chart
- 3 minutes to read
Short Description
A Doughnut3DSeriesView object is used to display the Doughnut Chart. This chart type belongs to the Pie, Doughnut and Funnel Series View type. This view allows you to compare the percentage values of different point arguments in the same series, and display these values as easy-to-understand pie slices (with a hole in the center of the pie).
A Doughnut chart is shown in the image below.
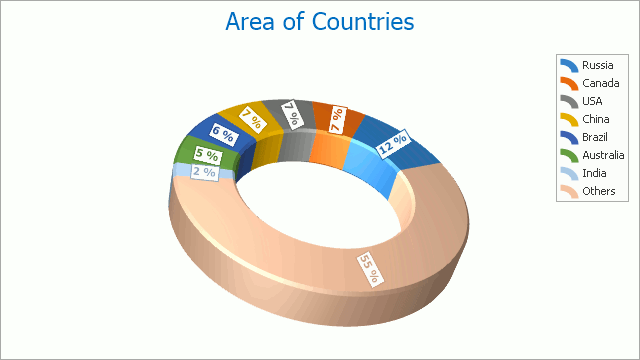
Chart Type Characteristics
The table below lists the main characteristics of this chart type.
| Feature | Value |
|---|---|
| Series View type | Doughnut3DSeriesView |
| Diagram type | SimpleDiagram3D |
| Number of arguments per series point | 1 |
| Number of values per series point | 1 |
Note
For information on which chart types can be combined with the Doughnut Chart, refer to the following help topic: Combining Different Series Views.
Example
The following example creates a ChartControl with a series of the Doughnut3DSeriesView type, sets its general properties, and adds this chart to a form at runtime. Before proceeding with this example, first create a Windows Forms Application in Visual Studio, and add all required assemblies to the project’s References list.
Then, add the following code to the Form.Load event handler.
using System;
using System.Windows.Forms;
using DevExpress.XtraCharts;
// ...

private void Form1_Load(object sender, EventArgs e) {
    // Create an empty chart.
    ChartControl DoughnutChart3D = new ChartControl();

    // Create a doughnut series.
    Series series1 = new Series("Doughnut Series 1", ViewType.Doughnut3D);

    // Populate the series with points.
    series1.Points.Add(new SeriesPoint("Russia", 17.0752));
    series1.Points.Add(new SeriesPoint("Canada", 9.98467));
    series1.Points.Add(new SeriesPoint("USA", 9.63142));
    series1.Points.Add(new SeriesPoint("China", 9.59696));
    series1.Points.Add(new SeriesPoint("Brazil", 8.511965));
    series1.Points.Add(new SeriesPoint("Australia", 7.68685));
    series1.Points.Add(new SeriesPoint("India", 3.28759));
    series1.Points.Add(new SeriesPoint("Others", 81.2));

    // Add the series to the chart.
    DoughnutChart3D.Series.Add(series1);

    // Adjust the value numeric options of the series.
    series1.PointOptions.ValueNumericOptions.Format = NumericFormat.Percent;
    series1.PointOptions.ValueNumericOptions.Precision = 2;

    // Adjust the view-type-specific options of the series.
    ((Doughnut3DSeriesView)series1.View).HoleRadiusPercent = 30;
    ((Doughnut3DSeriesView)series1.View).ExplodedPoints.Add(series1.Points[0]);

    // Access the diagram's options.
    ((SimpleDiagram3D)DoughnutChart3D.Diagram).RotationType = RotationType.UseAngles;
    ((SimpleDiagram3D)DoughnutChart3D.Diagram).RotationAngleX = -35;

    // Add a title to the chart and hide the legend.
    ChartTitle chartTitle1 = new ChartTitle();
    chartTitle1.Text = "3D Doughnut Chart";
    DoughnutChart3D.Titles.Add(chartTitle1);
    DoughnutChart3D.Legend.Visible = false;

    // Add the chart to the form.
    DoughnutChart3D.Dock = DockStyle.Fill;
    this.Controls.Add(DoughnutChart3D);
}