Create a Vertical Report in the Visual Studio Report Designer
- 8 minutes to read
This tutorial describes how to use vertical bands to create a report similar to the Profit and Loss Report demo in Visual Studio at design time.
- View Online Demo.
- View Desktop Demo (requires the DevExpress Demo Center to be installed).
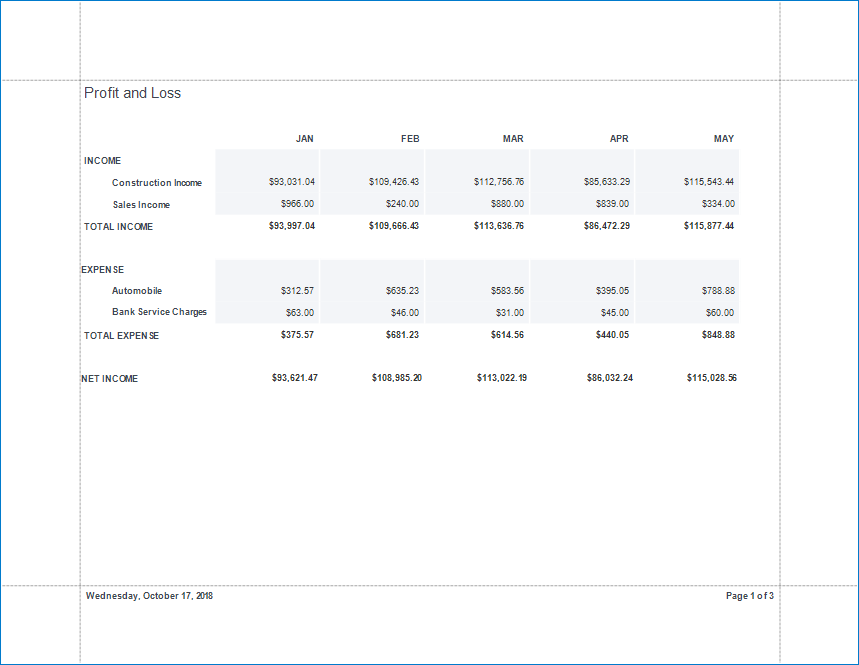
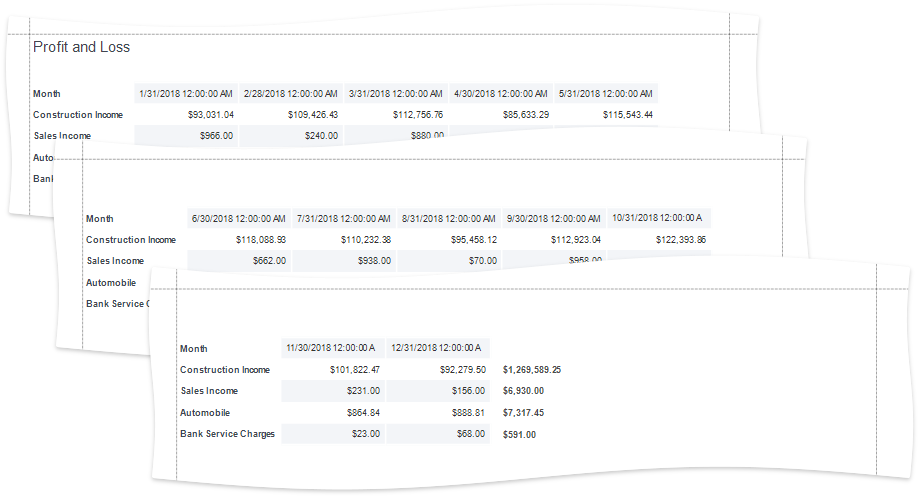
Profit and Loss Demo Report - Page 1
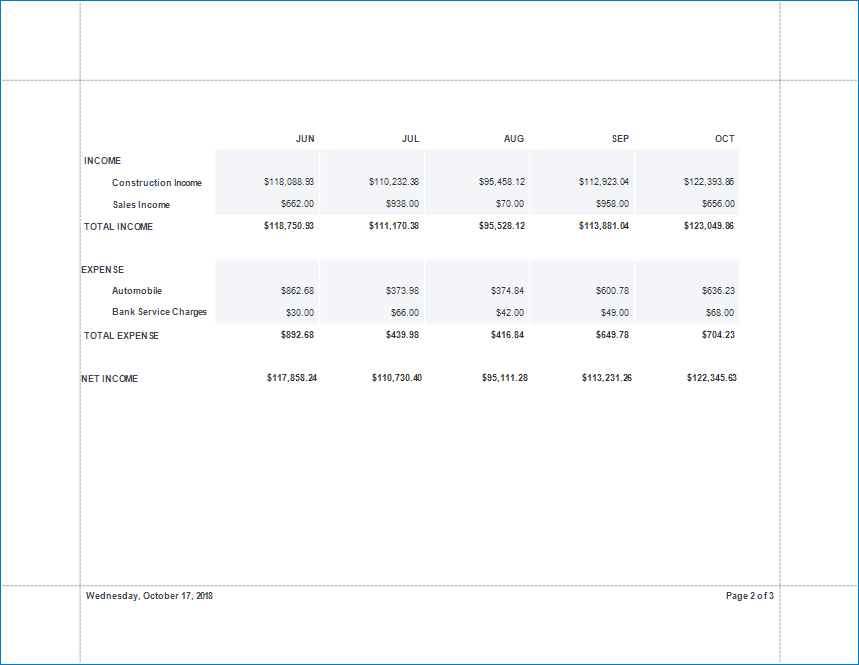
Profit and Loss Demo Report - Page 2
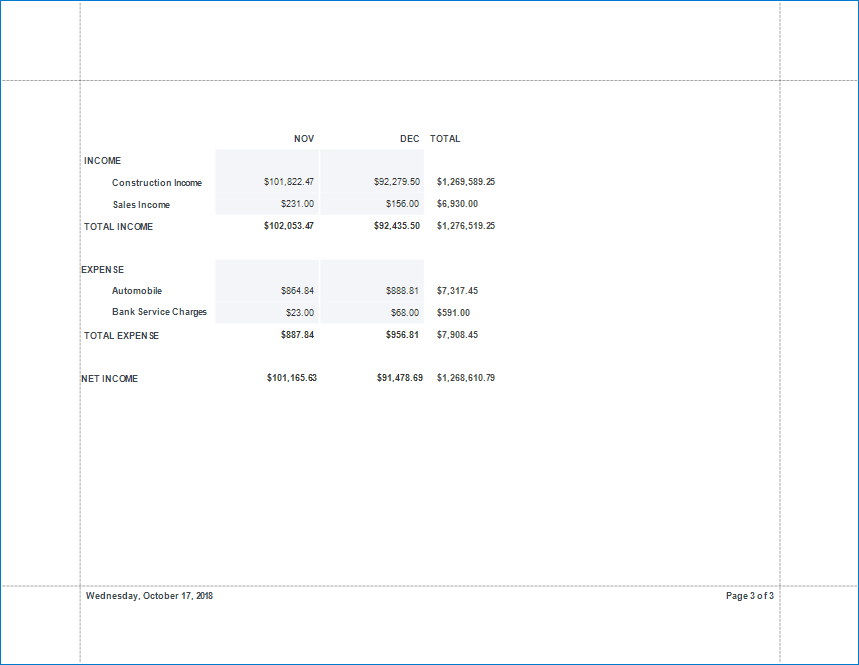
Profit and Loss Demo Report - Page 3
Tip
To get started with this tutorial, open an existing reporting application or create a new application. You can review the following section that explains how to create a reporting application on different platforms: Add a Report to Your .NET Application.
Add a Demo Data Source
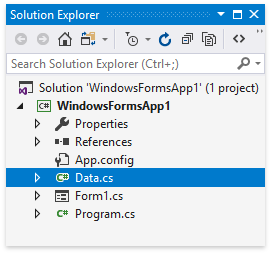
The Profit and Loss demo uses the Data business class that generates field values randomly. Add the Data.cs/Data.vb file to your project to use this tutorial.
using System;
using System.Collections.Generic;

namespace XtraReportsDemos.ProfitAndLossReport {
    public class Data {
        static List<Data> currentData;

        public DateTime Month { get; set; }

        public decimal ConstructionIncome { get; set; }
        public decimal SalesIncome { get; set; }

        public decimal CostOfGoodsSold { get; set; }
        public decimal JobExpenses { get; set; }

        public decimal Automobile { get; set; }
        public decimal BankServiceCharges { get; set; }
        public decimal Insurance { get; set; }
        public decimal PayrollExpenses { get; set; }
        public decimal Repairs { get; set; }
        public decimal ToolsAndMachinery { get; set; }

        public static List<Data> GetData() {
            if(currentData == null)
                currentData = CreateData();
            return currentData;
        }
        static List<Data> CreateData() {
            List<Data> result = new List<Data>();
            for(int i = 1; i <= 12; i++)
                result.Add(CreateItem(2018, i));
            return result;
        }
        static Data CreateItem(int year, int month) {
            Random rnd = new Random(month);
            return new Data() {
                Month = new DateTime(year, month, DateTime.DaysInMonth(year, month)),
                ConstructionIncome = rnd.Next(75000, 125000) + (decimal)rnd.Next(100) / 100,
                SalesIncome = rnd.Next(0, 1000),

                CostOfGoodsSold = rnd.Next(0, 3500) + (decimal)rnd.Next(100) / 100,
                JobExpenses = rnd.Next(5000, 35000) + (decimal)rnd.Next(100) / 100,

                Automobile = rnd.Next(300, 900) + (decimal)rnd.Next(100) / 100,
                BankServiceCharges = rnd.Next(10, 80),
                Insurance = rnd.Next(1000, 5000),
                PayrollExpenses = rnd.Next(9000, 18000),
                Repairs = rnd.Next(0, 400),
                ToolsAndMachinery = rnd.Next(0, 1000),
            };
        }
    }
}
You can apply the HighlightedClass attribute to the Data class to distinguish it from other classes in the Report Wizard.
// Ensure a reference to the DevExpress.DataAccess assembly is added to the project
using DevExpress.DataAccess.ObjectBinding;
//...
[HighlightedClass]
public class Data {
    public DateTime Month { get; set; }
    //...
}
Build your solution.
Add a Vertical Report
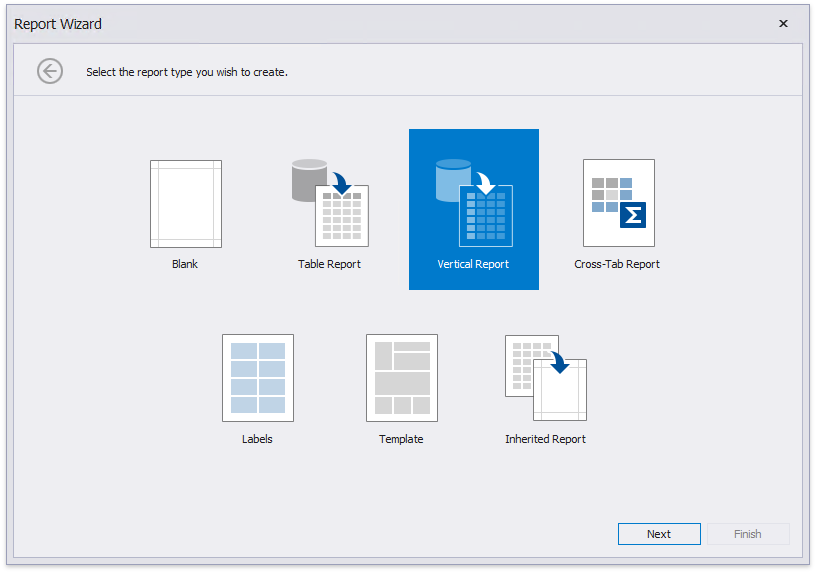
Invoke the Report Wizard.
Select Vertical Report and click Next.
(2.1-2.6) Set the report’s data source to the Data class that you added in previous steps.
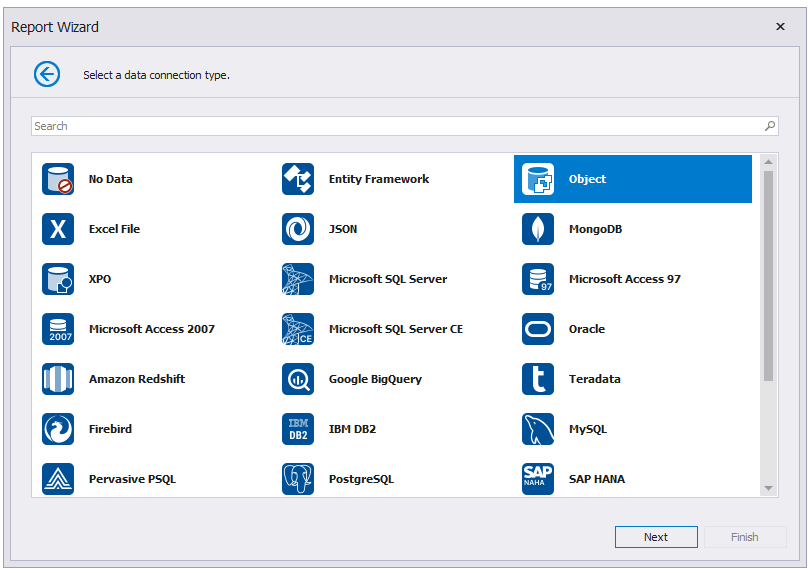
Select a data connection type
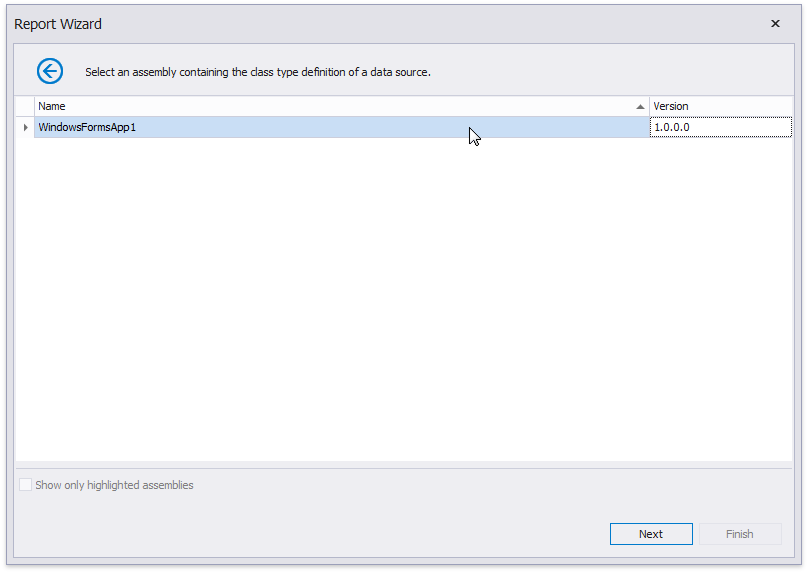
Select the assembly that contains the class type to bind
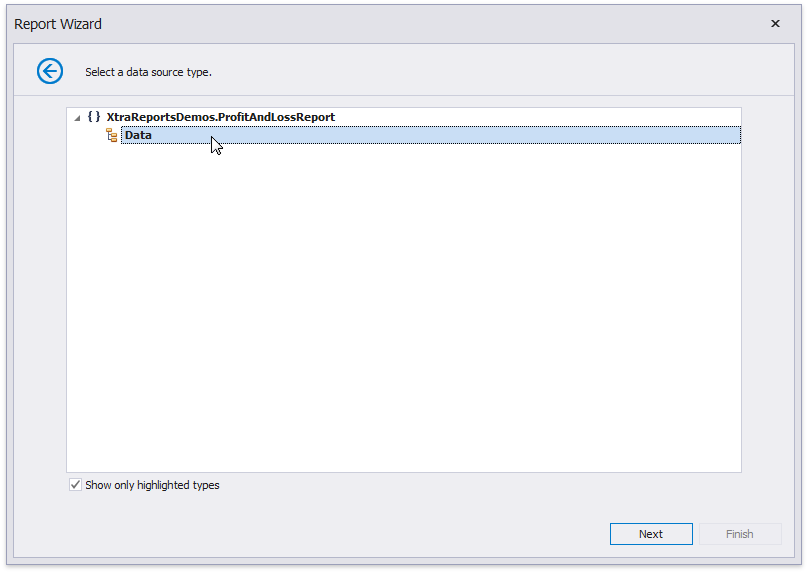
Select the class type to bind
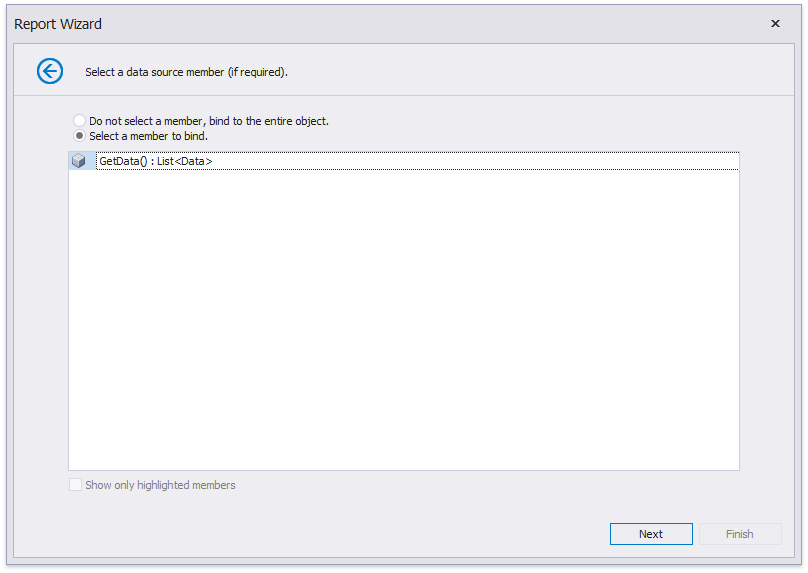
Select the class types member that provides data
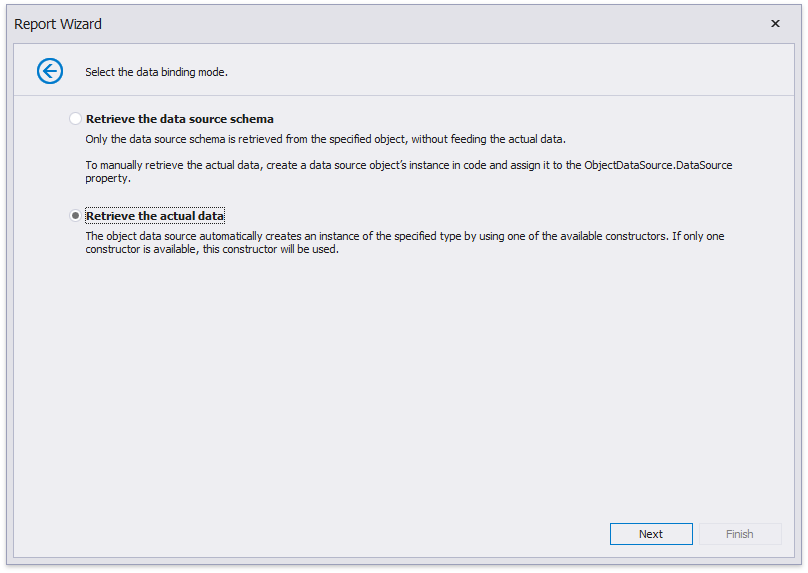
Select when to retrieve data
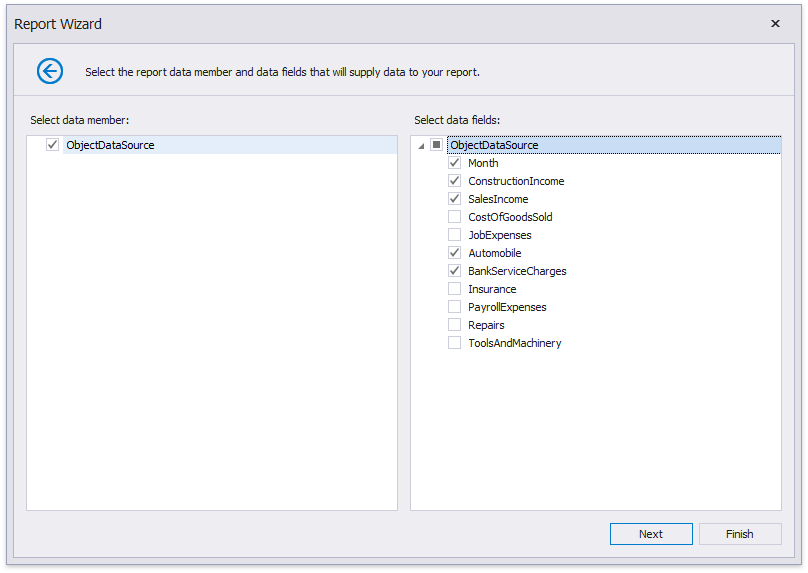
Select the data fields that should be included in the report.
Specify group data fields to create a report with grouped data (the report in this tutorial does not have group fields).
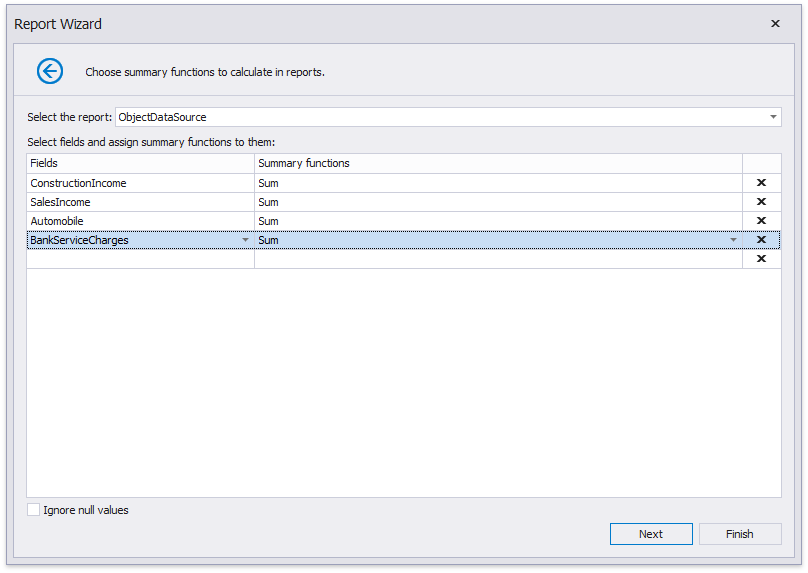
Add summary fields to the report.
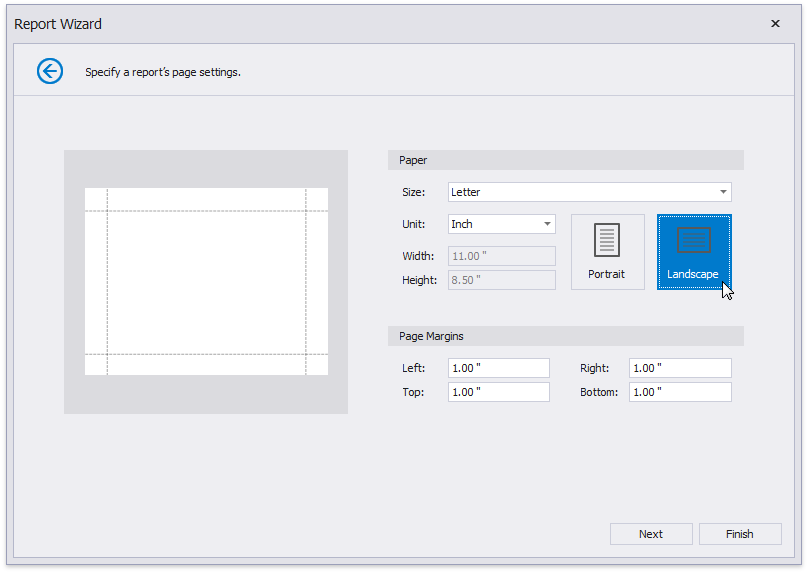
Change the report page layout to landscape so that the vertical table fits within the report.
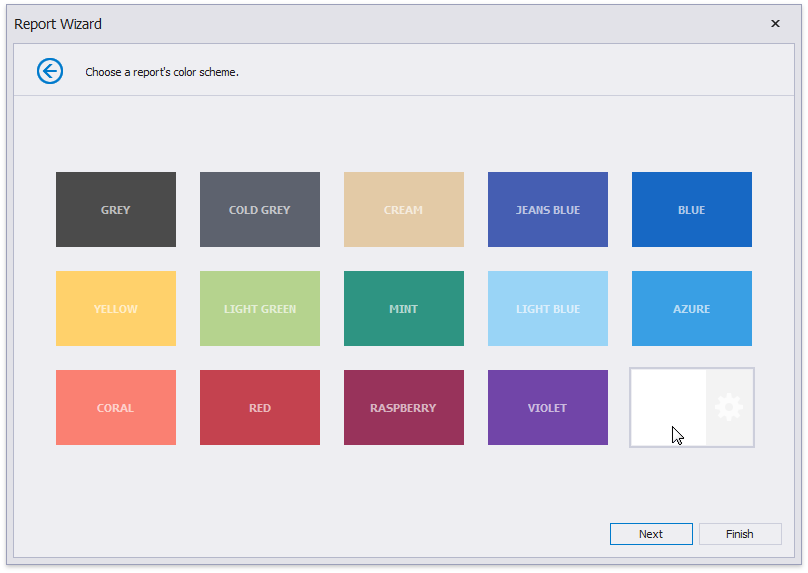
You can set the report’s color scheme.
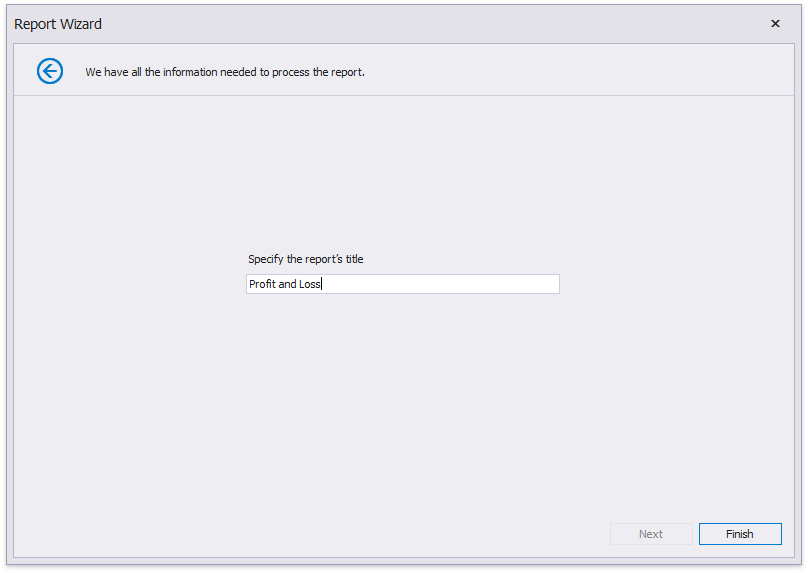
Specify the Profit and Loss title.
Click Finish and the generated report opens in the Report Designer.
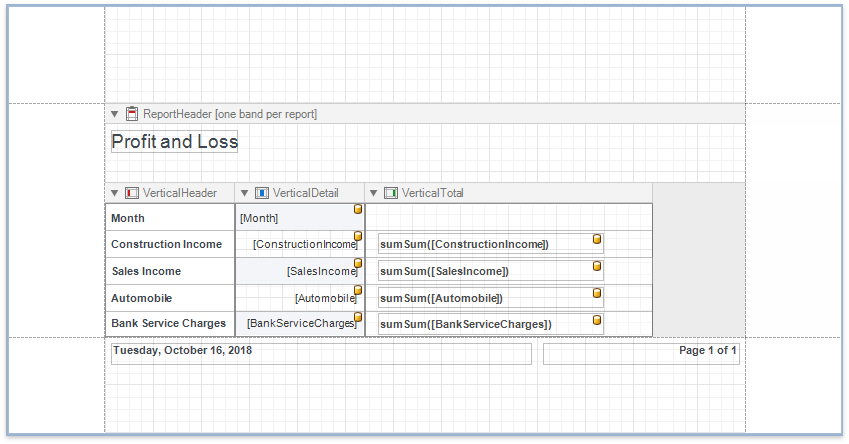
The wizard adds report controls to the following bands:
- Vertical Header band
Contains a table with a single column that displays headers of the report’s data fields. - Vertical Details band
Contains a table with a single column that is printed as many times as there are records in the report’s data source. - Vertical Total band
Contains a table with a single column that has as many labels in cells as there are summary functions you specified for each field in the Report Wizard (only the sum function for each field in this demo).
Switch to the Preview tab to see an intermediate result.
Tip
You can create a vertical report without using the Report Wizard. Right-click the report in the Report Designer and choose Insert Vertical Band in the invoked context menu. Refer to the Introduction to Banded Reports topic for more information.
Set up the Vertical Header Band
Perform the following modifications in the Vertical Header band:
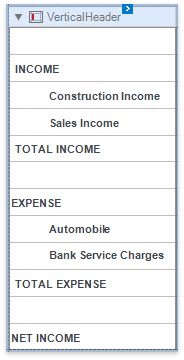
Remove the Month field’s header.
Reset the cell’s Text property.Add extra cells to the table’s column to display group names for data fields.
Add cells to the table’s column to display headers for vertical totals.
Set the data field headers’ Padding.Left property to 42.
Assign the HeaderData1Vertical style to all the cells in the Vertical Header band.
Set up the Vertical Detail Band
Perform the following modifications in the Vertical Detail band:
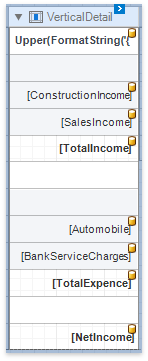
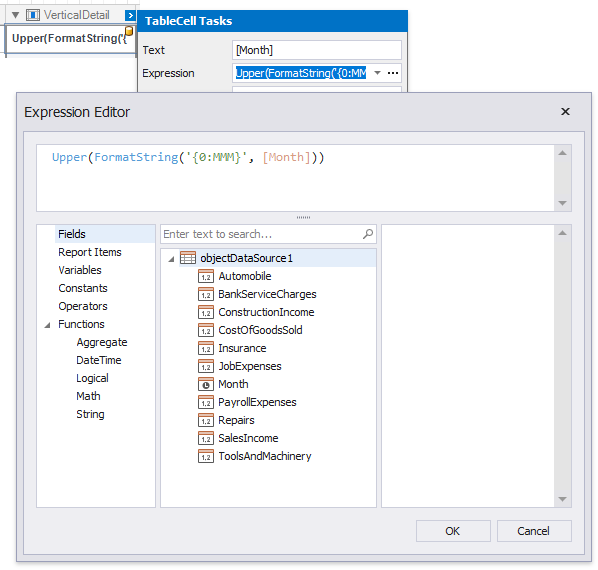
Set the Month field-bound cell’s Expression property to Upper(FormatString(‘{0:MMM}’, [Month])) and the TextAlignment property to MiddleRight.
Add cells corresponding to the extra cells you added in the Vertical Header band.
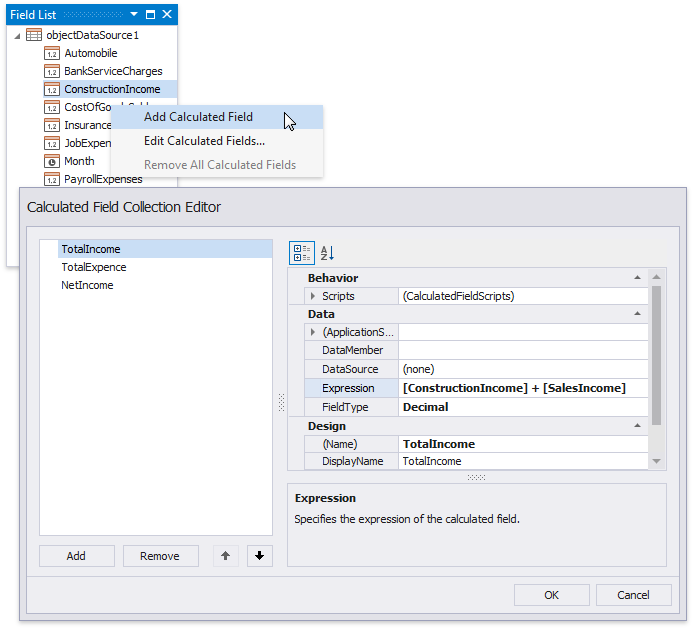
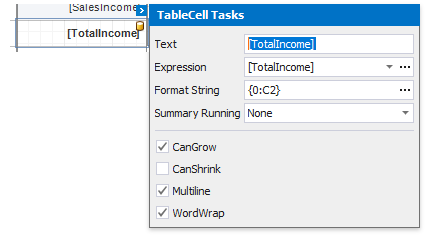
Add calculated fields and bind the corresponding cells to them.
Select all the data-bound cells and set their Format String property to {0:C2} (the default value that the wizard set for decimal fields).
Assign styles to the Vertical Detail band’s cells:
- The HeaderData1Vertical style – to the empty and Month cells.
- The DetailData1Vertical style – to the cells bound to the data source fields.
- The TotalData1Vertical style – to the cells bound to the calculated fields.
Set up the Vertical Total Band
Perform the following modifications in the Vertical Total band:
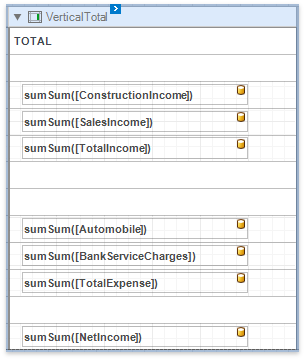
Set the first cell’s Text property to TOTAL.
Add cells corresponding to the extra cells you added in the Vertical Header band.
Add labels to display vertical totals that summarize totals in each group.
Copy and paste a label with a total function so that all totals have the same size and position. Specify the Expression and Format String properties for the added labels.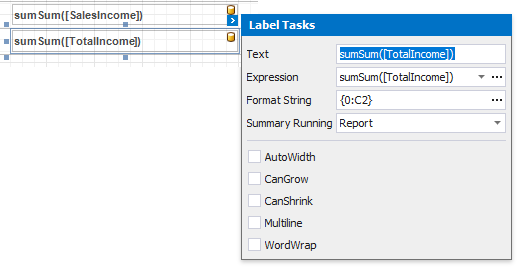
Assign styles to the Vertical Total band’s cells:
- The HeaderData1Vertical style – to the empty and TOTAL cells.
- The TotalData1Vertical style – to the cells with summary functions.
Preview the Result
Switch to the preview tab and see the result.
Profit and Loss Demo Report - Page 1
Profit and Loss Demo Report - Page 2
Profit and Loss Demo Report - Page 3
Set Vertical Table Options
You can set the following options to modify the vertical table:
- Set the Vertical Header band’s RepeatEveryPage property to false to display field headers once – on the first report page.
Set the Vertical Detail band’s BandLayout property to AcrossThenDown to print the data records one under the other on the same page. When there is no more empty space on the page, the content is printed on the next page. Otherwise, if the property is set to Layout, each record that does not fit within the page width is continued on the next page (as demonstrated in this demo).
- Specify the Vertical Detail band’s SortFields property to sort the report’s data.
Create a Vertical Report in the End-User Report Designer
Tutorials that explain how to create different reports in EUD Report Designers for WinForms and Web are included in the End-User Documentation online help section: