Introduction to Banded Reports
- 10 minutes to read
This topic provides an overview of banded reports and explains band types and how to use them:
- Band Overview
- Report Document Generation
- Print Order of Bands
- Mandatory Report Bands
- Header and Footer Bands
- Detail Report Band in a Master-Detail Report
- SubBand Bands
- Vertical Bands
- Cross-Band Content
- Manage Report Bands
- Apply Styles to Bands
Band Overview
A band is a section that contains report controls. Bands define the layout, position, and behavior of their elements. They also form the report’s hierarchical structure and help group and organize data based on different criteria.
Band types define their position and repetition pattern. Consider a few examples:
- A
ReportHeaderband appears only once in a report, at the top of the first page. - A
BottomMarginband appears at the bottom of every page. - A
Detailband may appear multiple times on each page. The report renders bands of this type one under another, for each data record in the associated dataset.
The following image shows a sample report layout and the Report Explorer window that visualizes the hierarchical report structure:

Report Document Generation
When the report is previewed, exported, or printed, the report document is generated. During document generation, report controls produce bricks, and bands determine how and where those bricks are printed on the page. A brick is an element with a defined size, content, and location. Bricks can display text, images, shapes, bar codes, and other text or graphics on a document page. For additional information, see Bricks.
The report engine analyzes the report layout, processes the data, and generates bricks from the controls in the defined bands. It then arranges these bricks on document pages according to the band structure and layout rules.
Print Order of Bands
Bands are printed one by one as they appear in a report, from first page to the last, from the top of the page to the bottom. This order determines the sequence in which the bands are processed and rendered during the document generation.
The BeforePrint event fires before a band is printed. Handle this event to adjust controls in the current band before it is rendered.
Use the BeforePrint event only to configure the current control/band and its child controls. Changes made to external objects may not be applied.
Mandatory Report Bands
A newly created blank report contains the following bands:
- Top Margin Band
- Displays information in the top margin of every report page.
- Detail Band
- Displays recurring data records from a report’s data source.
- Bottom Margin Band
- Displays information in the bottom margin of every report page.
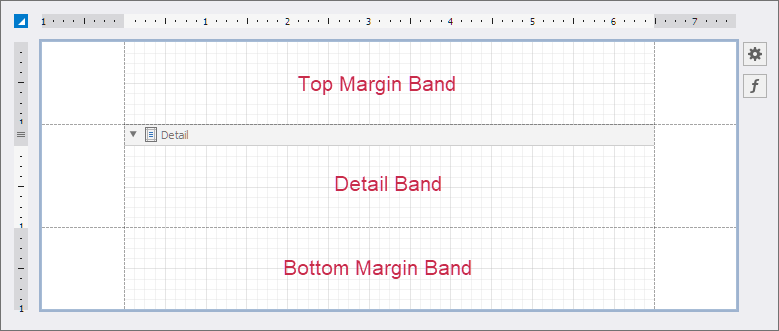
These three bands are mandatory and provide the basic report structure. You cannot delete them from the report.
Detail Band
The DetailBand is bound to a data source and repeats for each data record. It allows you to display information in a tabular format.
You can filter data displayed in the Detail band using the FilterString property. Specify a filter condition based on report parameters or other criteria.
Top Margin and Bottom Margin Bands
TopMarginBand and BottomMarginBand are repeated on every page of the report. These bands can display page numbers, company details, or service information such as report generation date.
The height of margin bands is defined by the report’s Margins property. Margin bands do not adjust their height to fit content. Content is cropped if it extends beyond the right edge of the band.
To display an image on every document page and adjust band height based on a loaded image, use the Page Header or Page Footer bands instead.
Header and Footer Bands
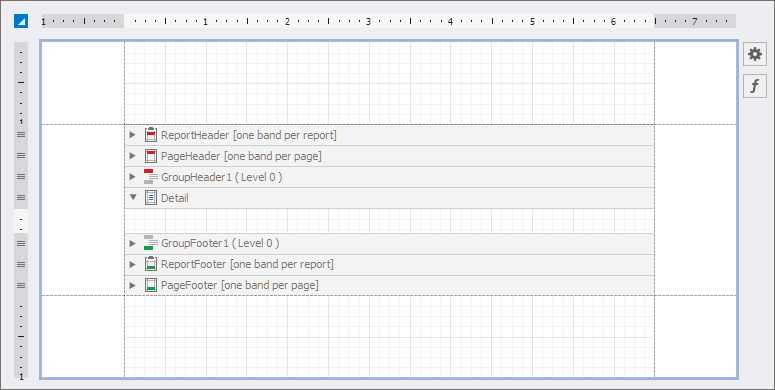
Header and footer bands display information at the beginning or end of a report, page, or group.
The following image shows header and footer bands in Visual Studio Report Designer:
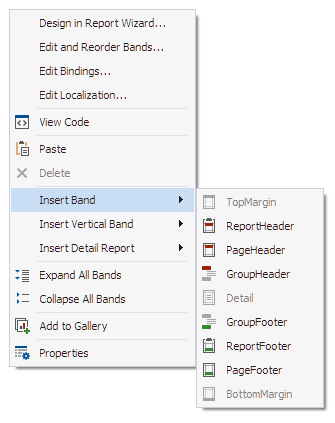
Right-click the report design surface and add bands to the report:
Report Header and Report Footer Bands
The ReportHeaderBand appears at the beginning of the report and usually displays information such as the report title and company logo.
The ReportFooterBand appears at the end of the report before the Page Footer and Bottom Margin bands. It is often used to display report summary or additional details.
Page Header and Page Footer Bands
The PageHeaderBand appears at the beginning of each page and is commonly used to display information such as page numbers, report parameters, or column headers.
The PageFooterBand can be used to display copyright notices, report descriptions, or any other information that should appear at the bottom of each page.
Initially, these bands are repeated on each page of the report. Use the PrintOn property to disable these bands on specific pages.
If a report is assigned to the XRSubreport.ReportSource property, the Page Header and Page Footer bands should not be present in that report. To display information on each page of the subreport, replace the PageHeaderBand with a GroupHeaderBand and enable the GroupHeaderBand.RepeatEveryPage property.
Group Header and Group Footer Bands
GroupHeaderBand and GroupFooterBand appear before and after each data group. Use them to label the data group or display group summaries. When no grouping is defined, Group Header and Group Footer bands are printed once for the entire report content. Enable the RepeatEveryPage setting to use these bands as table headers and footers on each page, even without grouping.
The Group and Sort Panel creates Group Header and Group Footer bands automatically. For additional information on data grouping in a report, refer to the following help article: Group and Sort the Report Data.
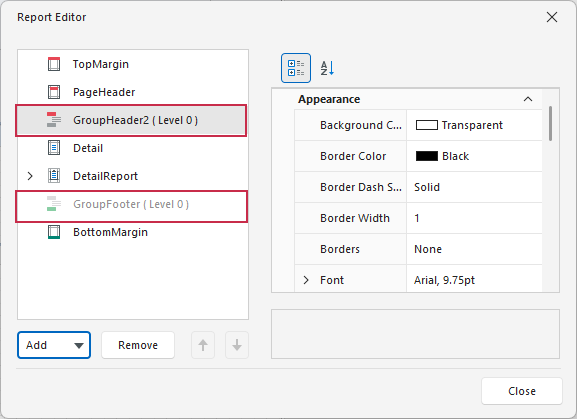
When you add a GroupHeaderBand or GroupFooterBand at design time or in code, the designer also displays a placeholder for its counterpart at that level in the editor. This placeholder indicates a matching band can be added. To use it, explicitly add the corresponding band first.
Detail Report Band in a Master-Detail Report
The DetailReportBand can display nested, related, or independent content in a report. A common use case is a master-detail report, where the Detail Report band serves as a container for a nested report. The nested report displays detailed data associated with each record in the master report.
Refer to the following topic for additional information on master-detail reports: Create a Master-Detail Report with a Detail Report Band in the VS Report Designer.
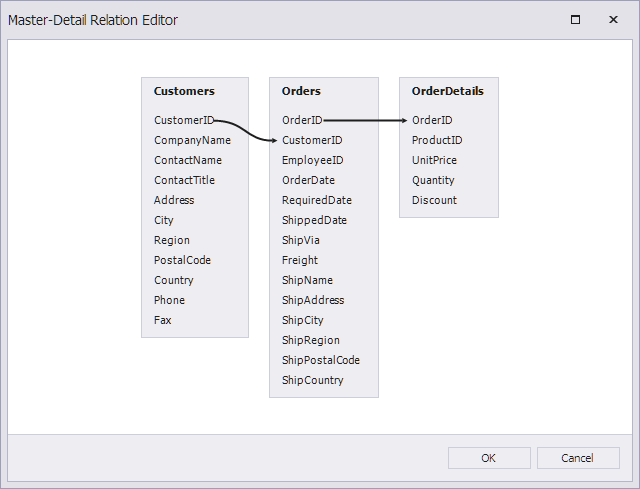
The following image shows a master-detail relationship between data tables:
The Detail and Detail Report bands can then be positioned as shown in the image below. The Group Header band in this report layout displays column headings.
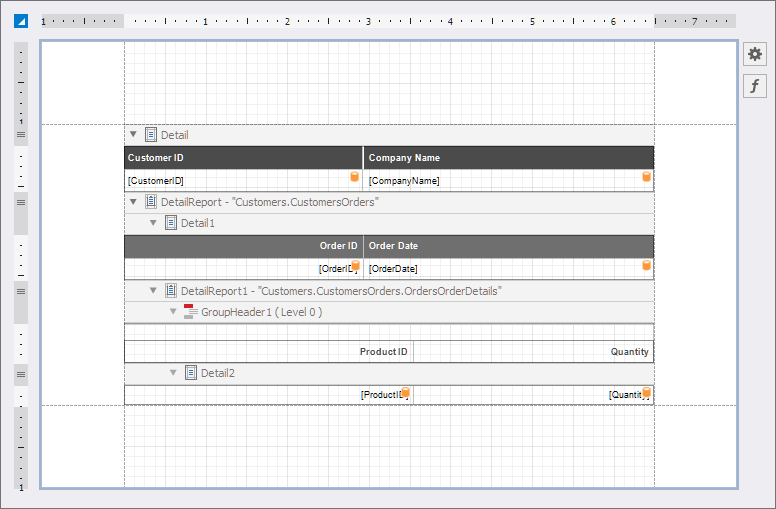
The master report iterates through the primary table. For each row in the primary table, the detail report iterates through rows in the secondary table that have the current key field value.
You can also use the Detail Report band to display data from multiple unrelated tables or data sources. If you do not bind the band to a data source, you can use it to display static content as an alternative to a sub-band.
SubBand Bands
The SubBand class defines a copy of the source band above. SubBand allows you to create multiple versions of a band within a single report. You can choose a version to display later based on specific criteria.

Refer to the following help topics for additional information on sub-bands:
Vertical Bands
You can replace the Detail band with the Vertical Header, Vertical Detail, and Vertical Total bands to display record fields vertically and print data records horizontally, from left to right, or from right to left when right-to-left mode is enabled.
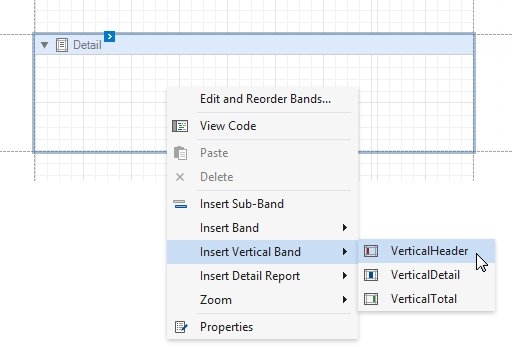
To add vertical bands to your report, right-click the report in the Report Designer and choose Insert Vertical Band in the invoked context menu.
Note
If your report’s Detail band contains report controls, all these controls are lost when you add a vertical band. If vertical bands contain report controls and you insert a Detail band, all these controls are lost as well.
The following vertical bands are available:
- VerticalHeaderBand
- Contains report data field headers. These headers are arranged vertically.
- VerticalDetailBand
- This band is printed for each record in the data source unless the data is filtered. Records are displayed horizontally, one after another.
- VerticalTotalBand
- This band is placed at the rightmost position (or leftmost if RTL is enabled). You can use the Vertical Total band for report summaries or conclusions.
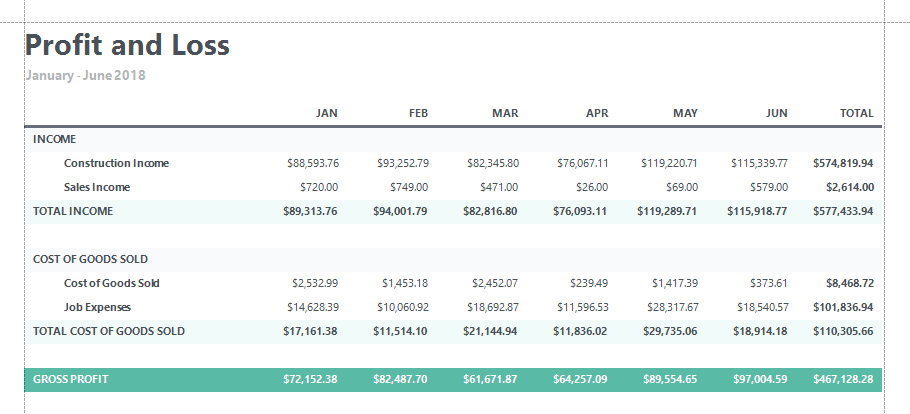
You can use the Report Wizard to create a report with vertical bands. For instructions on how to create a report based on the Profit and Loss demo, refer to the following help topic: Create a Report with Vertical Bands.
Cross-Band Content
Imagine you need to display a side panel next to repeating detail bands. This is what we call “Cross-Band Content”:
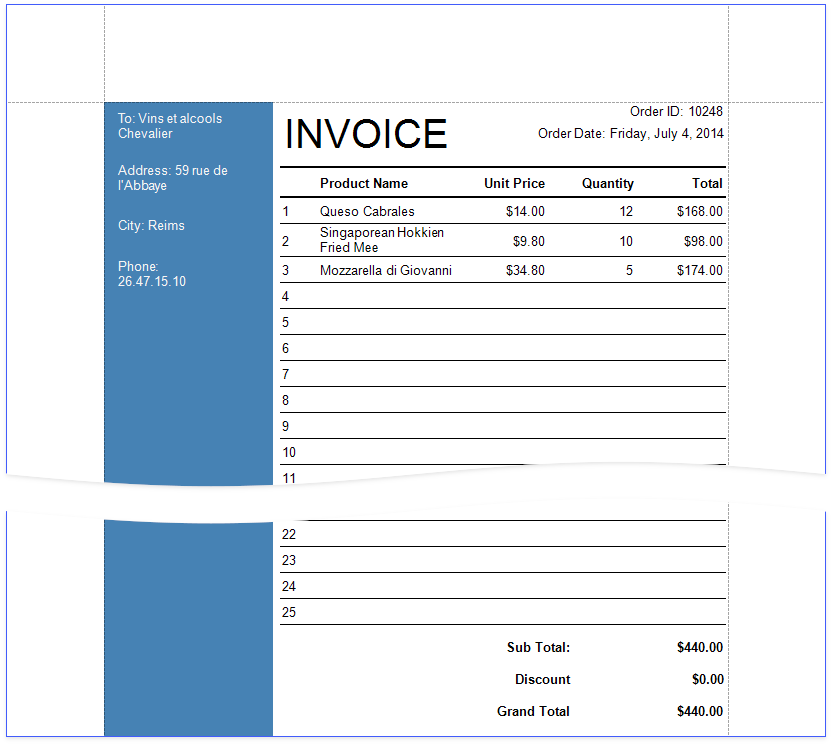
To create such a layout, use the PrintAcrossBands property.
For an example, refer to the following help topic: Create a Report with Cross-Band Content and Populated Empty Space in the VS Report Designer.
Manage Report Bands
Expand or Collapse Bands in the Report Designer
Click the arrow button on a band’s title to collapse or expand that band.

Right-click the report and select Collapse All Bands from the context menu to collapse all bands in a report. Select Expand All Bands to expand all report bands.

Right-click a band and select Collapse Other Bands from the context menu to collapse all bands except the clicked band.

Hide Bands in the Report Document
To avoid printing band content in a document, do one of the following:
- Set the band’s
Heightproperty to zero. - Set the band’s
Visibleproperty tofalse.
Select the band and set these properties in the Properties window.

Note
The BeforePrint event does not fire for bands with the Visible property set to false.
Remove Bands
Select a band on the report design surface and press DELETE. This will remove the band and all its content.
Add Bands
To add a band, right-click the report design surface and choose Insert Band in the invoked context menu.

You can insert the Detail Report band into a report if the report’s data source has master-detail relations.

Access the Bands Collection
To access the band collection, use one of the following methods:
Click the Edit and Reorder Bands context link in the report smart tag:

This command is also available in band context and smart tag menus.

The invoked editor allows you to reorder bands and change their properties.

Use the Report Explorer to edit and reorder bands. Select a band and edit its properties in the Properties grid.
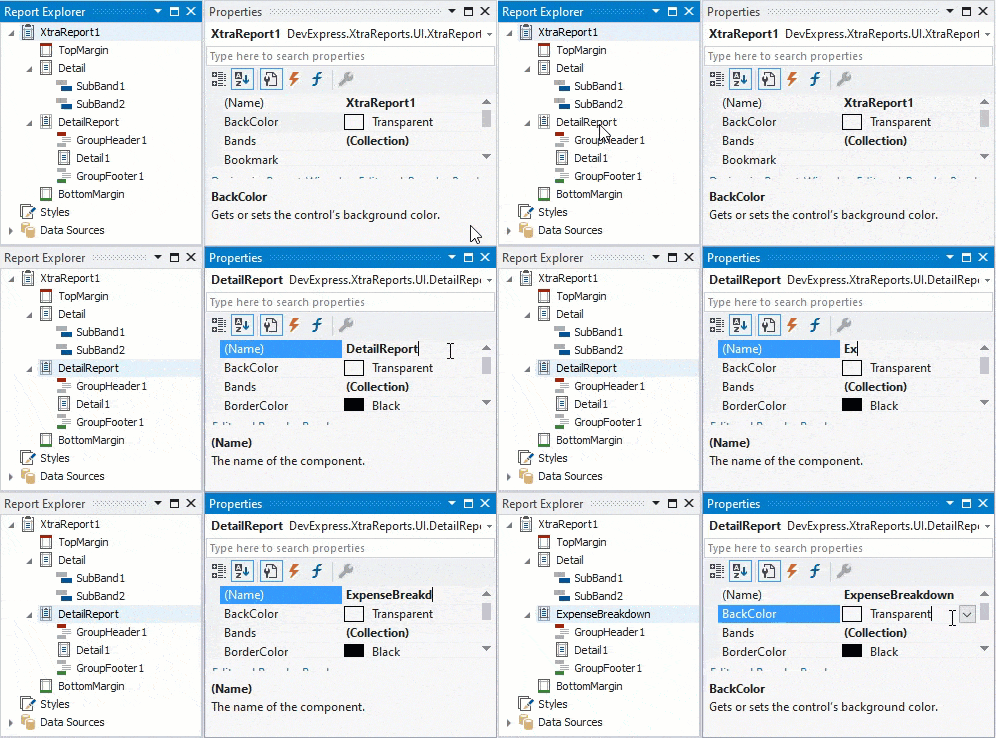
Drag a band to change its order or move inside/outside of another band. The drop targets are highlighted when you drag a band over them.
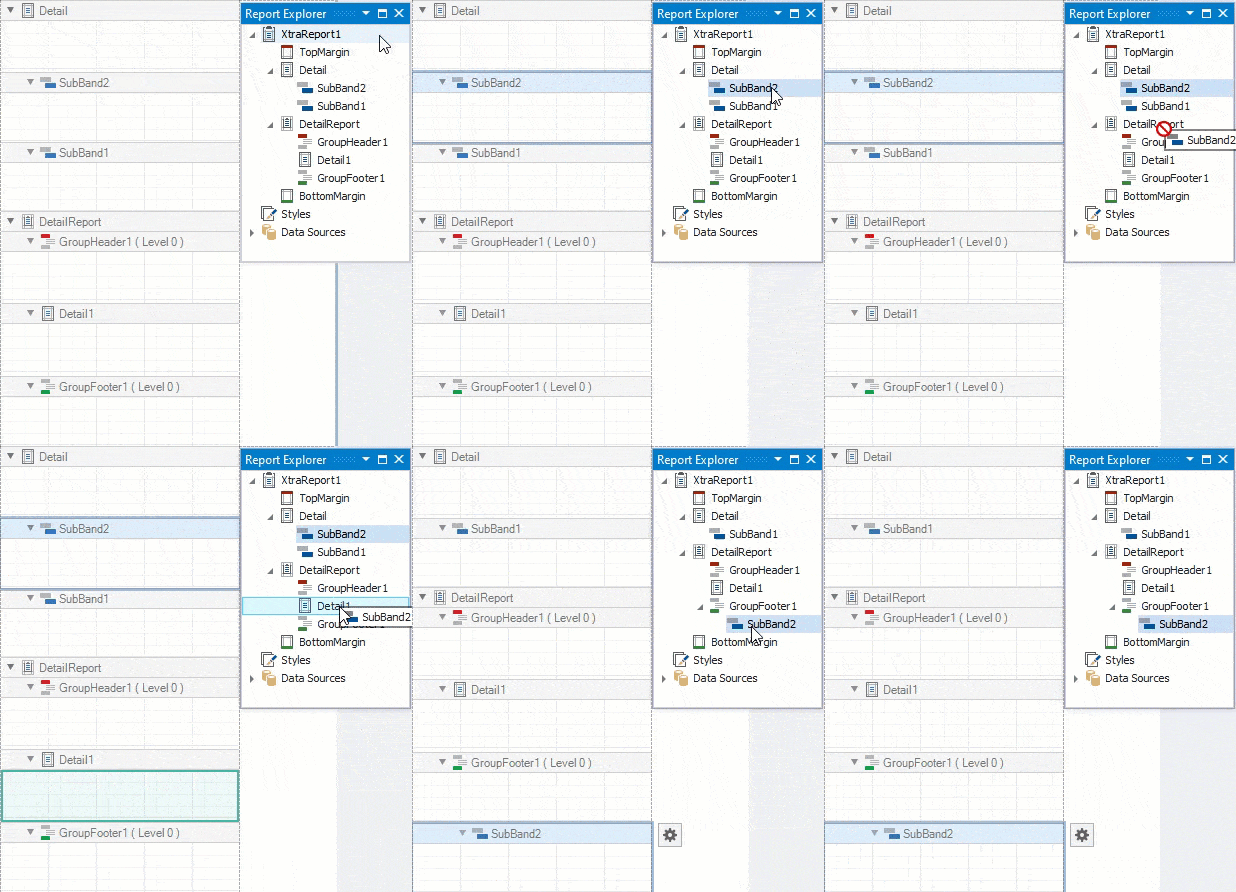
You can drag bands to the following targets:
Dragged Band Drop Targets SubBand All bands except TopMarginBand and BottomMarginBand GroupHeaderBand, GroupFooterBand XtraReport (root node), DetailReportBand DetailReportBand XtraReport (root node), DetailReportBand
Apply Styles to Bands
Select a band and switch to the Properties window. Expand the Styles group and set the Style property to the style name.

You can also drag a style from the Report Explorer onto a band (any type except DetailReportBand).

Introduction to Banded Reports in the End-User Report Designer
Tutorials that explain how to use this functionality in EUD Report Designers for WinForms and Web are included in the End-User Documentation online help section: