Axis Labels
- 7 minutes to read
This document describes how default and custom axis labels can be displayed and customized. Before you proceed with this document, you may wish to review the basics of using axes.
There are two types of axis labels available in XtraCharts: default and custom. It’s possible to obtain an individual axis label item at runtime. In addition, axis labels support an algorithm that prevents label overlap during resizing.
Thus, this document consists of the following sections.
- Default Axis Labels
- Custom Axis Labels
- Axis Label Item
- Format Axis Labels
- Resolve Overlapping for Axis Labels
Default Axis Labels
The default axis labels represent textual values for major tickmarks of a diagram axes.
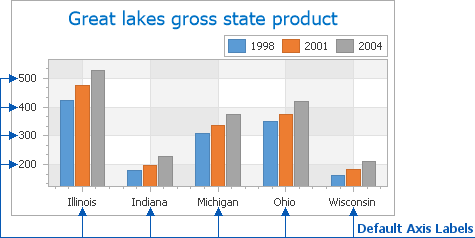
Axis labels are generated automatically based on the scale type of the axis to which they belong.
Note that when the qualitative scale type is specified, and you are required to organize the default axis labels in a custom order, create an instance of a class implementing the IComparer interface and assign it to the AxisBase.QualitativeScaleComparer property of an axis. This object will sort axis values in the required order.
The appearance of axis labels can be customized using the Axis2D.Label property. The AxisLabel.TextPattern property allows you to format axis label text.
Note
The appearance properties affect both default and custom axis labels, with the exception of the AxisLabel.TextPattern property, which has no effect upon custom labels.
Custom Axis Labels
In addition to the default axis labels, it’s possible to add custom ones.
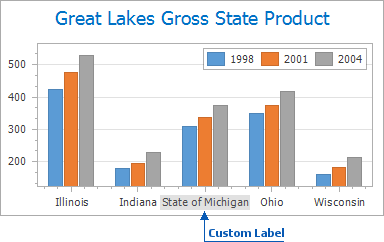
An individual custom label is represented by an instance of the CustomAxisLabel class. Custom labels of an axis reside in the axis’ CustomAxisLabelCollection, which can be accessed using the Axis2D.CustomLabels property. If the collection is empty (or doesn’t contain any visible custom labels), the default axis labels are shown.
To add custom labels to an axis at design time, do the following.
- Select the required axis in the chart’s diagram, and in the Properties window, locate the Axis2D.CustomLabels property.
Click its ellipsis button to invoke the Custom Axis Label Collection Editor.
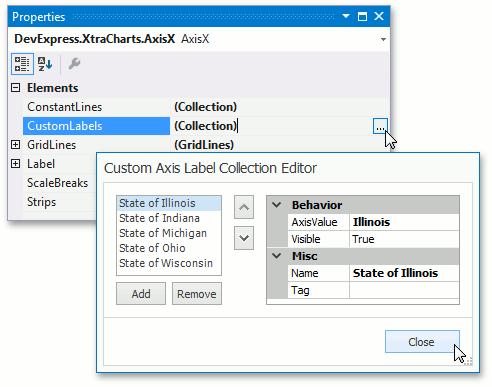
In this dialog, click Add to create a custom label, and customize its CustomAxisLabel.AxisValue and ChartElementNamed.Name properties.
Note that the value set for the CustomAxisLabel.AxisValue property should lie in the range specified by the AxisBase.WholeRange property, in order for the custom label to be visible on a diagram.
Finally, click Close to apply the changes and quit the dialog.
Since most of the appearance settings of axis’ custom labels are defined using the Axis2D.Label property of the axis, custom axis labels share their appearance settings with an axis’ default labels.
Note
By default, custom labels defined for an axis can’t be displayed along with its default labels. If an axis’s Axis2D.CustomLabels collection doesn’t contain a custom label whose CustomAxisLabel.Visible property is set to true, the default labels are displayed within the axis instead. To show both default and custom labels, set the Axis2D.LabelVisibilityMode property to AutoGeneratedAndCustom.
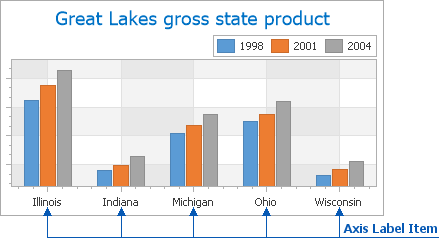
Axis Label Item
To customize text or appearance of an individual axis label, handle the ChartControl.CustomDrawAxisLabel event, which passes an AxisLabelItemBase object as a parameter. Use this object to modify axis labels as required.
Note
Note that the CustomDrawAxisLabel event enables you to modify default and custom axis labels.
For instance, you can change axis label color based on their values, as shown in the image below.
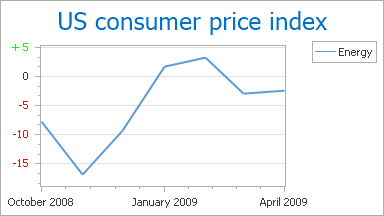
See the detailed example at How to: Individually Customize Axis Labels.
Format Axis Labels
To apply a date-time format to axis labels, use the AxisLabel.TextPattern property. At design time, you can locate it in the Properties window after selecting the required axis.
Since series labels represent data of their corresponding series points, you can apply formatting to this data using the SeriesLabelBase.TextPattern property. This property defines a pattern for displaying text by series labels. Various placeholders enclosed in braces correspond to the available display patterns.
A full list of available placeholders is detailed below.
| Pattern | Description |
|---|---|
| {S} | Displays the name of the series. |
| {A} | Displays a series point argument. |
| {V} | Displays series point values. |
| Pie (Donut) series specific placeholders | |
| {VP} | Displays series point values as percentages. |
| {TV} | Displays a total group value. |
| Stacked series specific placeholders | |
| {VP} | Displays series point values as percentages. |
| {G} | Displays the name of a stacked group. |
| {TV} | Displays a total group value. |
| Bubble series specific placeholders | |
| {W} | Displays the weight. |
| Range series specific placeholders | |
| {V1} | Displays the first value. |
| {V2} | Displays the second value. |
| {VD} | Displays the duration between the first and second data point values formatted using a common time format (e.g. HH:MM:SS for date time values and #.## for numeric values). |
| {VDTD} | Displays the duration between the first and second date-time data point values in days. |
| {VDTH} | Displays the duration between the first and second date-time data point values in hours. |
| {VDTM} | Displays the duration between the first and second date-time data point values in minutes. |
| {VDTS} | Displays the duration between the first and second date-time data point values in seconds. |
| {VDTMS} | Displays the duration between the first and second date-time data point values in milliseconds. |
| Financial series specific placeholders | |
| {OV} | Displays the open value. |
| {HV} | Displays the high value. |
| {LV} | Displays the low value. |
| {CV} | Displays the close value. |
Note
Make sure before using the {S} placeholder that the Series.Name property is specified.
You can also use standard and custom format specifiers, together with the placeholders and data field values (e.g., {V:F1}).
When the chart control or a series is bound to data, the text pattern may contain data field values in addition to default placeholders. For example, the data source contains the Discount field and the text pattern may looks like: {S}: {V:F2} (Discount: {Discount:P0}).
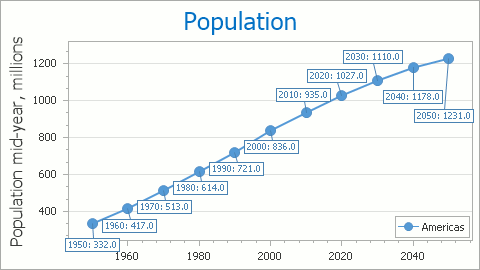
You can use standard and custom format specifiers, together with the placeholders to format numeric and date/time values (e.g., “{A}: {V:F1}”) .
The result is shown below.
To learn more, see the Format Specifiers topic.
In addition, you can specify a pattern using the Pattern Editor. The editor contains numerous predefined chart placeholders together with the date-time, numeric, percent, currency, and special formats allowing you to create a text pattern.
To invoke the editor, click the ellipsis button of the SeriesLabelBase.TextPattern property in the Properties window.
You can also customize the text pattern in the “Text Pattern” tab, which is located in the “Point Labels” Chart Wizard section.
Resolve Overlapping for Axis Labels
There are situations when axis labels don’t have enough space to represent all the information, for example, of a series argument.
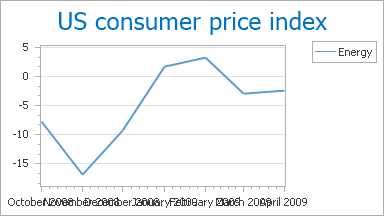
The resolve overlapping algorithm allows you to accomplish this task for axis labels.
Note that you don’ t need to write any lines of code to provide this feature, because all the necessary options (axis labels rotating, staggering and hiding during chart resizing) are available by default.
You can customize the way resolve overlapping is provided for axis labels by using the properties of the AxisLabelResolveOverlappingOptions object. This object can be accessed using the AxisLabel.ResolveOverlappingOptions property.
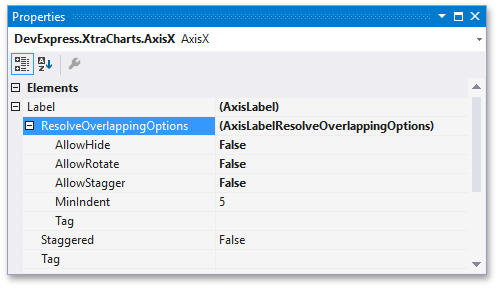
The following table lists properties that can be used to customize the resolve overlapping algorithm.
| Member | Description |
|---|---|
| AxisLabelResolveOverlappingOptions.AllowHide | Gets or sets a value indicating whether or not to hide axis labels when resolving any overlap. |
| AxisLabelResolveOverlappingOptions.AllowRotate | Gets or sets the value that indicates whether or not to rotate axis labels when resolving overlapping labels. |
| AxisLabelResolveOverlappingOptions.AllowStagger | Gets or sets a value indicating whether or not to stagger axis labels when resolving overlapping labels. |
| AxisLabelResolveOverlappingOptions.MinIndent | Gets or sets the minimum indent between adjacent axis labels, when an overlap resolution algorithm is applied to them. |
Note
The AllowRotate and AllowStagger properties only affect labels of a horizontal XY-Diagram axis (an arguments x-axis or values y-axis when XYDiagram.Rotated is enabled).