Constant Lines
- 2 minutes to read
This document describes how to display a constant line across an axis, and customize the constant line. Before you proceed with this document, you may wish to review the basics of using axes.
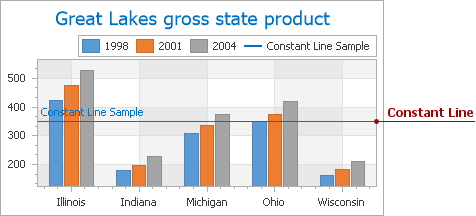
A Constant line is used to visually represent an axis value as a line perpendicular to the axis to which it belongs. It can be drawn over or behind the diagram‘s series.
To create a constant line and add it to an axis at design time, locate the axis in the Properties window, and click the ellipsis button for the Axis2D.ConstantLines property. The Constant Line Collection Editor will appear.
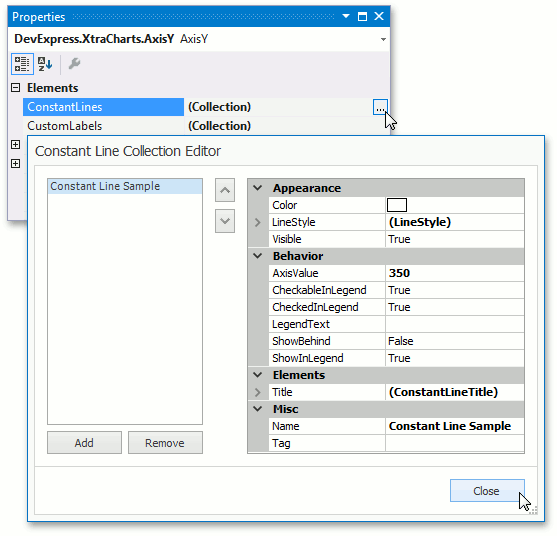
In this editor, click Add to create a constant line, and define its properties.
The most important property of a constant line is the ConstantLine.AxisValue property, which determines the value on the axis across which the constant line is drawn. This value should fall into the range defined for the current axis, in order for the constant line to be visible on a diagram.
Note
The ConstantLine.AxisValue should be appropriate for the axis scale type.
The axis type and constant line axis value | The resulting image |
|---|---|
X-axis ConstantLine.AxisValue = 350 |
|
Y-axis ConstantLine.AxisValue = Indiana |
|


To control whether a constant line should be drawn behind or above a chart’s series, use the ConstantLine.ShowBehind property. Note that this property doesn’t affect the position of a constant line’s title.
| The property value | The resulting image |
|---|---|
| ConstantLine.ShowBehind = false |  |
| ConstantLine.ShowBehind = true |  |
Then, it’s possible to display a constant line’s titles both in a diagram and in a legend.
- To display a constant line’s description in a chart’s legend, enable the ConstantLine.ShowInLegend property and define the ConstantLine.LegendText property.
- To display a title adjacent to a constant line, enable its TitleBase.Visible property, and define the Title.Text property of the title. In addition, you can adjust the positioning of the title via the ConstantLineTitle.Alignment and ConstantLineTitle.ShowBelowLine properties. The appearance of the title is defined by its TitleBase.TextColor, TitleBase.Antialiasing and TitleBase.Font properties.
Finally, it is possible to define the appearance options of a constant line, notably the ConstantLine.Color, LineStyle.DashStyle and LineStyle.Thickness properties.
Use the ConstantLine.Visible property to hide a constant line while maintaining it in an axis’ collection.