SeriesLabelBase.TextPattern Property
Gets or sets a string which represents the pattern specifying the text to be displayed within series labels.
Namespace: DevExpress.XtraCharts
Assembly: DevExpress.XtraCharts.v18.2.dll
Declaration
[XtraChartsLocalizableCategory(XtraChartsCategory.Behavior)]
[XtraSerializableProperty]
public string TextPattern { get; set; }Property Value
| Type | Description |
|---|---|
| String | A String, which represents the pattern. The default value is Empty. |
Remarks
Use the TextPattern property to define a pattern for displaying text by series labels. Various placeholders enclosed in braces correspond to the available display patterns. For example, a pair of placeholders specified together (e.g., {A} - {V}), will cause each data point to be represented by both its argument and value, separated by a hyphen.
Note
The series labels are hidden by default for a series. To see how the TextPattern property affects the label format, set the SeriesBase.LabelsVisibility property to true. For more information, refer to Series Point Labels.
A full list of available placeholders is detailed below.
| Pattern | Description |
|---|---|
| {S} | Displays the name of the series. |
| {A} | Displays a series point argument. |
| {V} | Displays series point values. |
| Pie (Donut) series specific placeholders | |
| {VP} | Displays series point values as percentages. |
| {TV} | Displays a total group value. |
| Stacked series specific placeholders | |
| {VP} | Displays series point values as percentages. |
| {G} | Displays the name of a stacked group. |
| {TV} | Displays a total group value. |
| Bubble series specific placeholders | |
| {W} | Displays the weight. |
| Range series specific placeholders | |
| {V1} | Displays the first value. |
| {V2} | Displays the second value. |
| {VD} | Displays the duration between the first and second data point values formatted using a common time format (e.g. HH:MM:SS for date time values and #.## for numeric values). |
| {VDTD} | Displays the duration between the first and second date-time data point values in days. |
| {VDTH} | Displays the duration between the first and second date-time data point values in hours. |
| {VDTM} | Displays the duration between the first and second date-time data point values in minutes. |
| {VDTS} | Displays the duration between the first and second date-time data point values in seconds. |
| {VDTMS} | Displays the duration between the first and second date-time data point values in milliseconds. |
| Financial series specific placeholders | |
| {OV} | Displays the open value. |
| {HV} | Displays the high value. |
| {LV} | Displays the low value. |
| {CV} | Displays the close value. |
Note
Make sure before using the {S} placeholder that the Series.Name property is specified.
You can also use standard and custom format specifiers, together with the placeholders and data field values (e.g., {V:F1}).
When the chart control or a series is bound to data, the text pattern may contain data field values in addition to default placeholders. For example, the data source contains the Discount field and the text pattern may looks like: {S}: {V:F2} (Discount: {Discount:P0}).
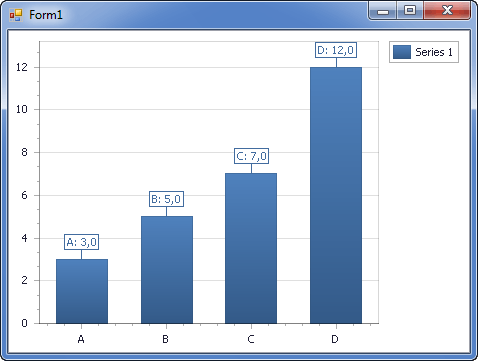
The following image shows this property in action with the “{A}: {V:F1}” pattern.
In addition, you can specify a pattern using the Pattern Editor (the editor is invoked by clicking the ellipsis button of the TextPattern property in the Properties window) or via the Chart Designer.
The image below shows the Pattern Editor invoked for the TextPattern property.
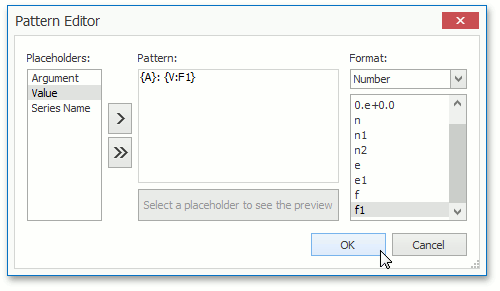
The editor contains numerous predefined chart placeholders together with the date-time, numeric, percent, currency, and special formats allowing you to create a text pattern.
Example
The following example demonstrates how to specify the appearance of series labels in the Pie chart using its text pattern.
To accomplish this at runtime, it is necessary to handle the Form.Load event and then transform series labels of the Series object to the corresponding labels of the PieSeriesLabel object.
And finally, specify the pattern for series labels using the SeriesLabelBase.TextPattern property.
Note
A complete sample project is available at https://github.com/DevExpress-Examples/obsolete-how-to-adjust-point-options-of-the-pie-series-view-type-at-runtime-e3801
using System;
using System.Windows.Forms;
using DevExpress.XtraCharts;

namespace XtraChart_PointOptions {
    public partial class Form1 : Form {
        public Form1() {
            InitializeComponent();
        }

        private void Form1_Load(object sender, EventArgs e) {
            // Create an empty chart.
            ChartControl pieChart = new ChartControl();

            // Create a pie series.
            Series series1 = new Series("A Pie Series", ViewType.Pie);

            // Populate the series with points.
            series1.Points.Add(new SeriesPoint("Russia", 17.0752));
            series1.Points.Add(new SeriesPoint("Canada", 9.98467));
            series1.Points.Add(new SeriesPoint("USA", 9.63142));
            series1.Points.Add(new SeriesPoint("China", 9.59696));
            series1.Points.Add(new SeriesPoint("Brazil", 8.511965));
            series1.Points.Add(new SeriesPoint("Australia", 7.68685));
            series1.Points.Add(new SeriesPoint("India", 3.28759));
            series1.Points.Add(new SeriesPoint("Others", 81.2));

            // Add the series to the chart.
            pieChart.Series.Add(series1);

            // Adjust the text pattern of the series label.
            PieSeriesLabel label = (PieSeriesLabel)series1.Label;
            label.TextPattern = "{A}: {VP:P0}";

            // Detect overlapping of series labels.
            label.ResolveOverlappingMode = ResolveOverlappingMode.Default;

            // Add the chart to the form.
            pieChart.Dock = DockStyle.Fill;
            this.Controls.Add(pieChart);
        }
    }
}
Related GitHub Examples
The following code snippets (auto-collected from DevExpress Examples) contain references to the TextPattern property.
Note
The algorithm used to collect these code examples remains a work in progress. Accordingly, the links and snippets below may produce inaccurate results. If you encounter an issue with code examples below, please use the feedback form on this page to report the issue.