Visual Ranges and Whole Ranges
- 5 minutes to read
This document provides a brief overview of a visual range and a whole range, and also details how to change the range of axis coordinates, therefore limiting or increasing the volume of data represented by an associated series.
For the purpose of simplicity, this document will use the most common diagram type - an XY-diagram.
Note that before reading this topic, it may be useful to review the basics of using axes in the WinForms Chart Control.
This document consists of the following sections.
Range Overview
The axis range is represented by the whole range and the visual range.
The whole range determines the overall range of series associated with the axis, while the visual range determines the axis range of values displayed on a single screen. The visual range can be less than or equal to the whole range. So, changing the visual range does not affect the whole range. If the maximum or minimum value of the series extends beyond the visual range, the chart’s series will partially (or completely) fall out of the diagram.
If you wish a chart to indicate that not all series points are visible, set either the XYDiagram2D.EnableAxisXScrolling or XYDiagram2D.EnableAxisYScrolling property to true to enable scrolling and show a scrollbar.
The following table shows this behavior for the X-axis with the scroll bar enabled.
| Visual and Whole Ranges relation | The resulting image |
|---|---|
| The Visual Range is equal to the Whole Range | 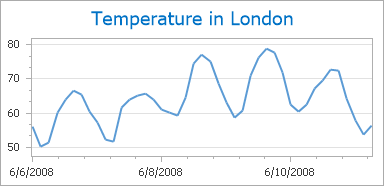 |
| The Visual Range is less than the Whole Range | 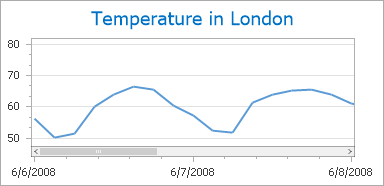 |
In addition, you can customize the appearance (color, size and alignment) of scroll bars along scrollable axes. To learn more, refer to the Panes Appearance topic.
The axis range can be defined for all existing diagram types, with the exception of the Simple and Simple 3D diagrams, since they do not have axes.
When the Qualitative and DateTime scale types are used for an axis (see Axis Scale Types for more information), XtraCharts recalculate the maximum and minimum range values into float numbers internally. These float representations are available from the Range.MinValueInternal and Range.MaxValueInternal properties.
In addition, you can specify whether or not to take side margins into account when calculating an axis range. This way, you will not have to worry about showing the outermost points of an associated series at the diagram’s edge. To accomplish this, set the Range.AutoSideMargins to true. You can specify custom side margins using the Range.SideMarginsValue property. This resets the Range.AutoSideMargins property. The following table shows this feature in action.
The property value | The resulting image |
|---|---|
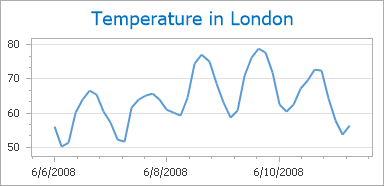
AutoSizeMargins = true |
|
AutoSizeMargins = false, SideMarginsValue=10 |
|

By default, the Range.AutoSideMargins property is disabled for series of the area view types (area, stacked area and full-stacked area).
Note
The Ranges values are dependent on the DateTimeScaleOptions.MeasureUnit (NumericScaleOptions.MeasureUnit) property. If MeasureUnit changes, then ranges will be set to default, so when it is required to configure both MeasureUnit and Ranges, specify the MeasureUnit first.
The sections below detail how to customize the visual range and the whole range individually.
Visual Range
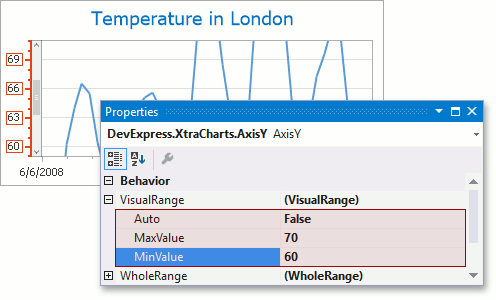
The visual range is represented by the VisualRange object, and can be accessed from the AxisBase.VisualRange property. The visual range (as well as the whole range) is defined by the Range.MaxValue and Range.MinValue property values, which are calculated automatically, since the Range.Auto property of the axis is enabled by default. However, you can customize these properties as your needs dictate.
Note
The visual range does not affect the whole range. If you wish to extend an axis range beyond its default bounds, change the AxisBase.WholeRange property first. After that you can determine which part of the entire range should be shown on a single screen by specifying the AxisBase.VisualRange property.
The following image demonstrates the available axis range options and the appearance of a chart, when its Range.Auto property is set to true.
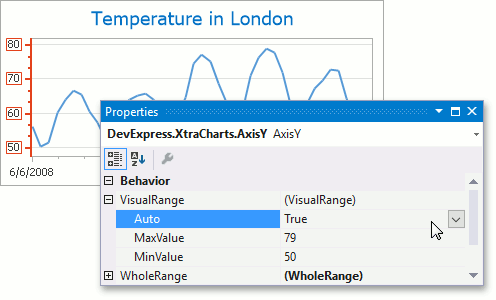
When the visual range is set to Auto, its minimum and maximum axis values are calculated automatically, based on the whole range values. So, to define an axis range in Auto mode (for example, when scrolling or zooming is not used), you should change the minimum and maximum values of the whole range. In this case, the visual range will be equal to the whole range.
If you change the default range for the axis visual range (or whole range) using either the Range.MinValue or Range.MaxValue properties, this automatically resets the Range.Auto property.
Note
When you scroll a visual range, it automatically changes the Range.MaxValue and Range.MinValue property values.
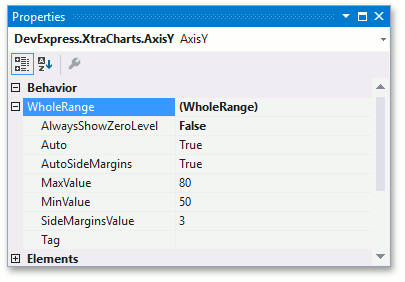
Whole Range
The whole range is represented by the WholeRange object, which is accessed from the AxisBase.WholeRange property. The whole range options are similar to the visual range options of axes.
To learn more on axes, see the documents in the Axes section.