Pie and Donut Series Views
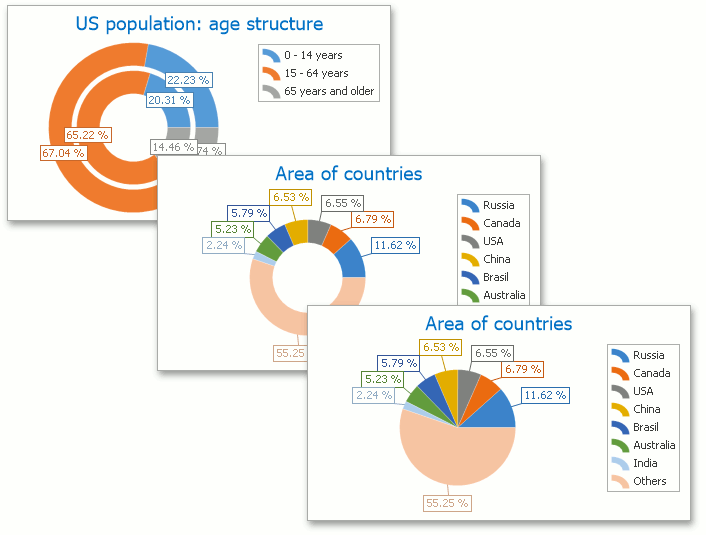
The series of Pie, Doughnut and Funnel view types are used to compare the percentage values of different point arguments in the same series. These charts may be useful to determine which point value or values in the point series is (are) the most significant. Several charts of this type are represented on the following image.
Below is the list of all such charts currently available in the WinForms Chart Control.


