Axis Scale Types
- 5 minutes to read
This document details the use of different axis scale types in the WinForms Chart Control: their purpose, implementation and capabilities.
It consists of the following sections.
Scale Types Overview
A Scale type axis is based on the associated series scale type, which is defined by the SeriesBase.ArgumentScaleType property for the X-axis (axis of arguments) and SeriesBase.ValueScaleType property for the Y-axis (axis of values).
Note
You don’t need to change the argument scale type of the SeriesBase.ArgumentScaleType property (set to the Auto mode, by default) because the type of a series point argument is detected automatically based on the type of underlying data.
For the SeriesBase.ValueScaleType property, it’s only possible to assign either the ScaleType.Numerical or ScaleType.DateTime scale type, since the axis of values (the Y-axis) cannot be represented by the qualitative scale.
The three scale types available in the WinForms charts are:
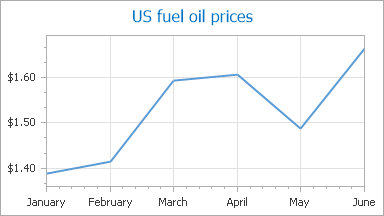
The following image demonstrates the look of a chart with the X-axis having the date-time scale type (with the format set to display months only), and the Y-axis having the numerical scale type (in the currency format).
The available scale types, their purpose and capabilities, are described in the following sections of this document.
Numerical Scale Type
When the SeriesBase.ArgumentScaleType or SeriesBase.ValueScaleType property is set to ScaleType.Numerical, the numerical scale type is assigned to the corresponding (X or Y) axis. Numerical scale specific settings can be accessed using the AxisBase.NumericScaleOptions property of an axis.
The numerical scale type represents the values or arguments of series points as numerical values on an axis. Since these values are treated as numbers by the chart control, you can perform special operations over them that would otherwise be impossible.
Note
For the axis of arguments (the X-axis), you don’t need to change the scale type using the SeriesBase.ArgumentScaleType property (set to the Auto mode, by default) because the type of series point argument is detected automatically based on the type of underlying data.
The numeric scale type is assigned to the SeriesBase.ValueScaleType property, by default. So, dealing with date-time values, you should set the date-time scale type manually.
With the numerical scale type defined, you can locate the AxisLabel.TextPattern property at design time in the Properties window, after selecting the required axis label.
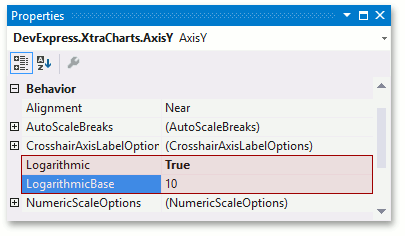
Another useful feature available for the numerical scale types is the capability to represent an axis’ values logarithmically using the AxisBase.Logarithmic and AxisBase.LogarithmicBase properties.
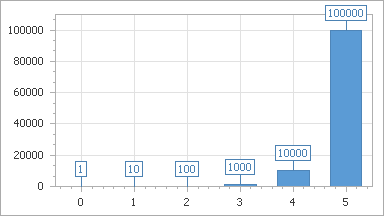
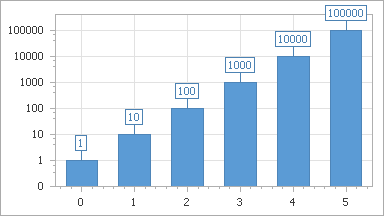
These options can be helpful when a chart’s series have a significant data range. And the chart’s numerical axes can display all numerical values using logarithmic equivalents. For example, if the AxisBase.LogarithmicBase property is set to 10, only 4 uniform axis steps will exist between 1 and 100,000, so the chart’s data is represented in a more compact and intelligible way. The following images demonstrate this property in action.
The property values | The resulting image |
|---|---|
Logarithmic = false |
|
Logarithmic = true LogarithmicBase = 10 |
|
Note that if the AxisBase.Logarithmic scale is enabled, the ScaleGridOptionsBase.GridSpacing property’s value is rounded to integer values.
Date-Time Scale Type
When the SeriesBase.ArgumentScaleType or SeriesBase.ValueScaleType property is set to ScaleType.DateTime, this means that the date-time scale type is assigned to the corresponding (X or Y) axis. Date-time scale specific settings can be accessed using the AxisBase.DateTimeScaleOptions property of an axis.
Note
It’s important to distinguish the date-time scale type from the qualitative and numerical types, in which case values are treated as either strings or as numbers.
You can leave the default argument scale type mode (the SeriesBase.ArgumentScaleType property is set to the Auto mode) as is. Because the type of series point argument is detected automatically based of the type of underlying data.
With the date-time scale type, it’s possible to exclude holidays and weekends from an axis scale. To learn more on this, refer to Data Aggregation.
Qualitative Scale Type
When the SeriesBase.ArgumentScaleType property is set to ScaleType.Qualitative, this means that the qualitative scale type is assigned to the corresponding X-axis.
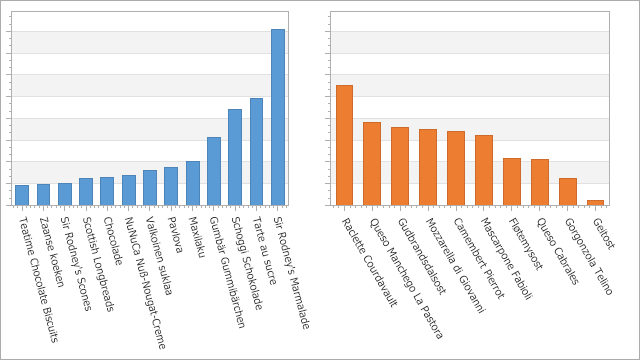
The qualitative scale type represents the values of series points as ordinal textual values on an axis (e.g. A, B, III, IV). Since this scale type can only be assigned to the SeriesBase.ArgumentScaleType property, it’s only available for the axis of arguments (the X-axis).
Important
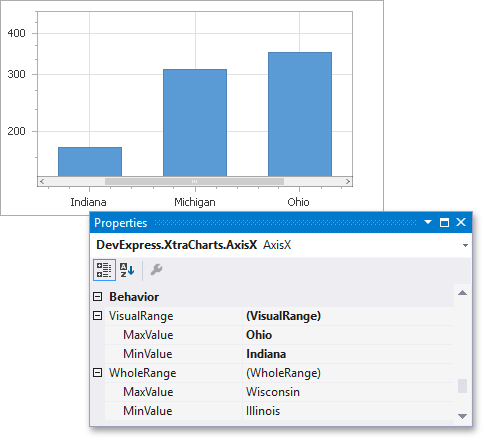
Choosing the qualitative scale type does not prohibit using visual range or whole range. However, in this case you should define the Range.MinValue and Range.MaxValue properties thoroughly, using the values appropriate to your series. In this situation, note that internally, the real axis values are converted to numeric values to make internal calculations possible. You can determine the internal numeric equivalents of the qualitative values using the Range.MinValueInternal and Range.MaxValueInternal properties.
In a case where multiple series are associated with a single qualitative axis, there are different scenarios possible, and they’re briefly described below.
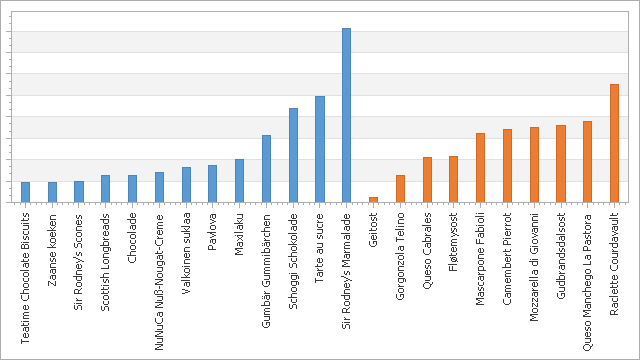
If the series have different types of qualitative arguments, they are plotted one after another along the X-axis, and the axis values are shown sequentially.
In this situation, you may be required to employ secondary axes. In this case, the achieved result may be similar to the one demonstrated below.
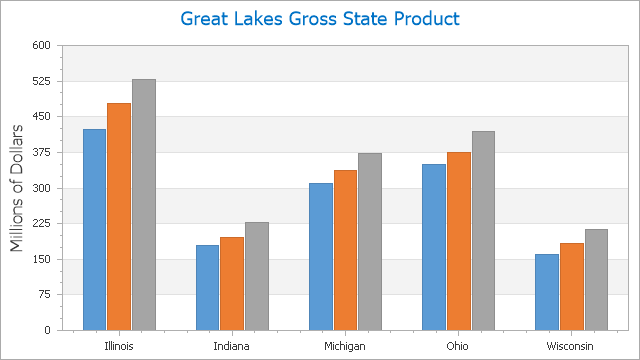
In addition, you can plot the series within separate panes. The following image demonstrates this alternative.
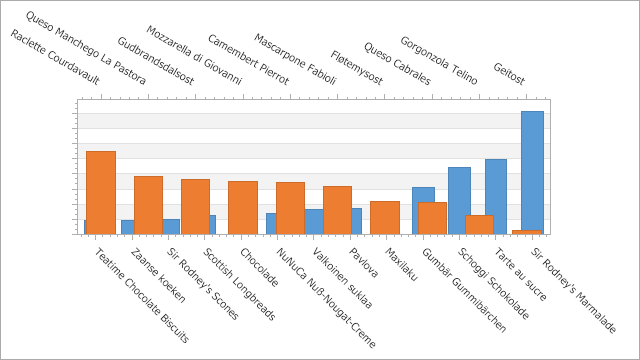
If the string arguments of different series associated with the same axis coincide, they are plotted against the same axis value simultaneously.
Again, you can still employ secondary axes and additional panes.
A combination of both these variants is shown in the following image.