How to: Plot an XY Series with a Histogram in a Chart
- 3 minutes to read
The following example shows how to plot an XY series with a histogram in the same chart:
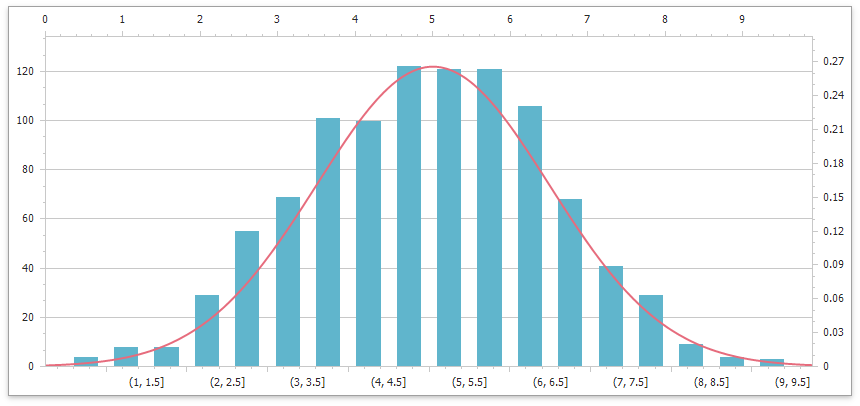
In this example, a Line series displays a normal distribution curve on the secondary axis and is aligned with a histogram on the primary axis.
using DevExpress.XtraCharts;
using System;
using System.Collections.Generic;
using System.Collections.ObjectModel;
using System.Windows.Forms;

namespace WindowsFormsApplication1 {
    public partial class Form1 : Form {
    // ...
        public List<DataPoint> NormalDistribution { get; private set; }
        public List<DataPoint> Histogram { get; private set; }

        public Form1() {
            InitializeComponent();
            CreateDataSource();

            Series histogram = new Series("Histogram", ViewType.Bar);
            histogram.ArgumentDataMember = "XValue";
            chartControl1.Series.Add(histogram);
            ((BarSeriesView)histogram.View).AggregateFunction = SeriesAggregateFunction.Histogram;

            Series line = new Series("Line", ViewType.Spline);
            line.ArgumentDataMember = "XValue";
            line.ValueDataMembers[0] = "YValue";
            chartControl1.Series.Add(line);
            LineSeriesView lineView = (LineSeriesView)line.View;
            lineView.AggregateFunction = SeriesAggregateFunction.None;
            XYDiagram diagram = (XYDiagram)chartControl1.Diagram;
            diagram.AxisX.NumericScaleOptions.ScaleMode = ScaleMode.Interval;
            diagram.AxisX.Visibility = DevExpress.Utils.DefaultBoolean.True;
            diagram.AxisX.WholeRange.MinValue = MinValue;
            diagram.AxisX.WholeRange.MaxValue = MaxValue;
            diagram.AxisX.WholeRange.SideMarginsValue = 0;
            diagram.AxisX.NumericScaleOptions.IntervalOptions.GridLayoutMode = GridLayoutMode.GridShiftedLabelCentered;
            diagram.AxisX.NumericScaleOptions.IntervalOptions.Count = BinCount;
            diagram.AxisX.NumericScaleOptions.IntervalOptions.DivisionMode = IntervalDivisionMode.Count;
            diagram.AxisX.Label.TextPattern = "{}{OB}{A1:F1}, {A2:F1}{CB}";
            SecondaryAxisY secondaryAxisY = new SecondaryAxisY();
            diagram.SecondaryAxesY.Add(secondaryAxisY);
            lineView.AxisY = secondaryAxisY;
            SecondaryAxisX secondaryAxisX = new SecondaryAxisX();
            diagram.SecondaryAxesX.Add(secondaryAxisX);
            secondaryAxisX.WholeRange.SideMarginsValue = 0;
            lineView.AxisX = secondaryAxisX;

            line.DataSource = NormalDistribution;
            histogram.DataSource = Histogram;
        }
        // ...
    }
}
See Also