How to: Bind a Chart to a SQL Data Source
- 2 minutes to read
This tutorial uses the sample Northwind database. This database should be deployed on a SQL Server instance. The following topic describes how to create the Northwind database on your SQL server: Get the sample databases for ADO.NET code samples.
Step 1. Create a Chart
Create or open a Windows Forms Application.
Drop the ChartControl onto the form from the DX.21.2: Data & Analytics toolbox tab.
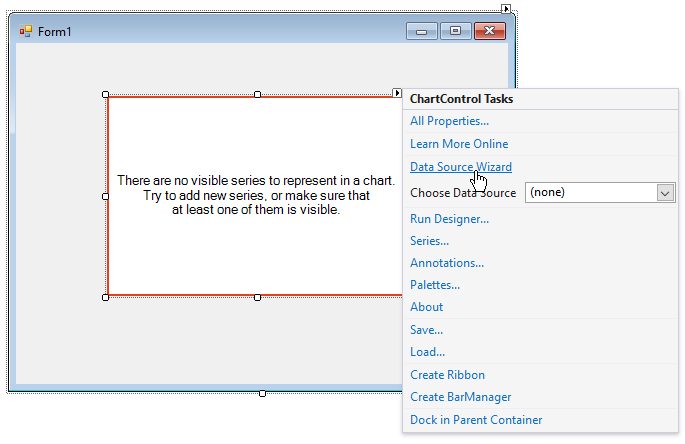
When you add the Chart Control to the form, the Chart Designer is shown. We do not need to use this designer, so click the Cancel button to close it.
Step 2. Bind Chart to a Data Source
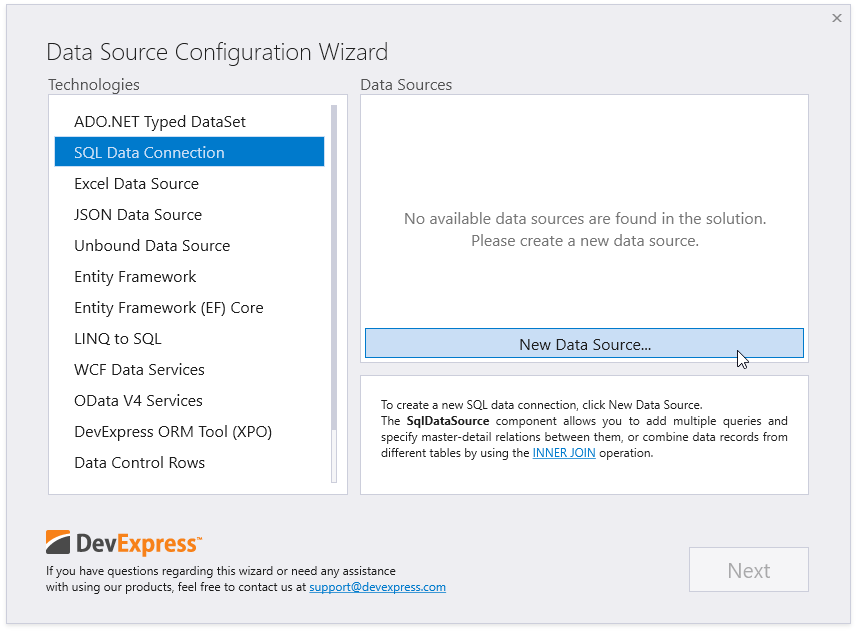
Click the chart’s smart tag to invoke its Tasks list and select the Data Source Wizard item. See the following help topic for more information on this wizard: Data Source Wizard.
Select SQL Data Connection from the Technologies list and click the New Data Source… button.
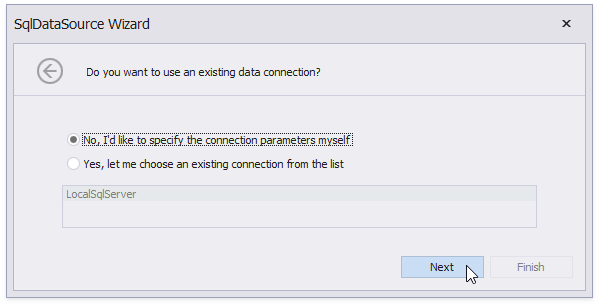
Select No, I’d like to specify the connection parameters myself in the SqlDataSource Wizard and click Next.
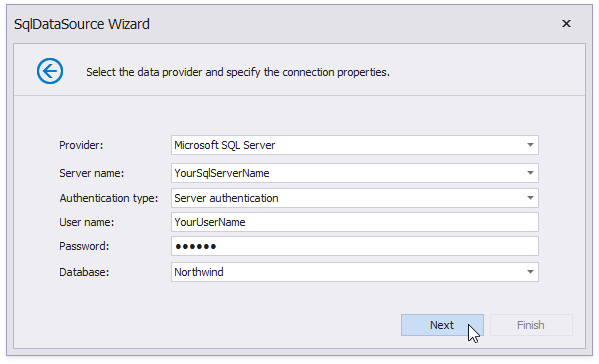
Fill the following form fields according to your SQL Server settings:
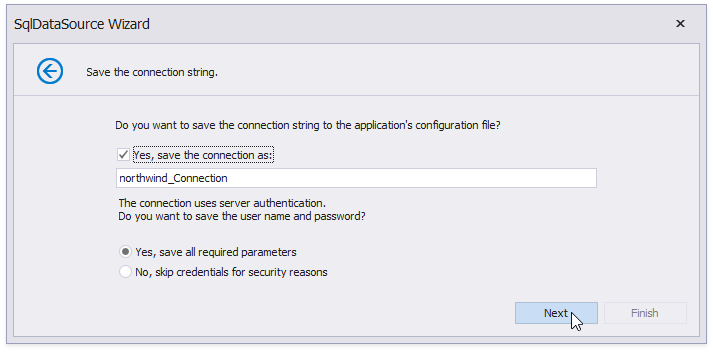
Select Yes, save all required parameters and click Next to save the connection string to the app.config file.
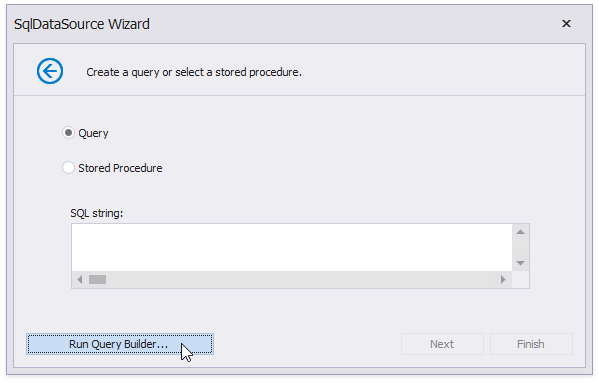
Click Run Query Builder on the next form:
Use Query Builder to construct SQL queries. Drag the Products table to the work area and select the ProductID, ProductName, CategoryID, and UnitPrice fields. Click the Filter button to launch the Filter Editor.
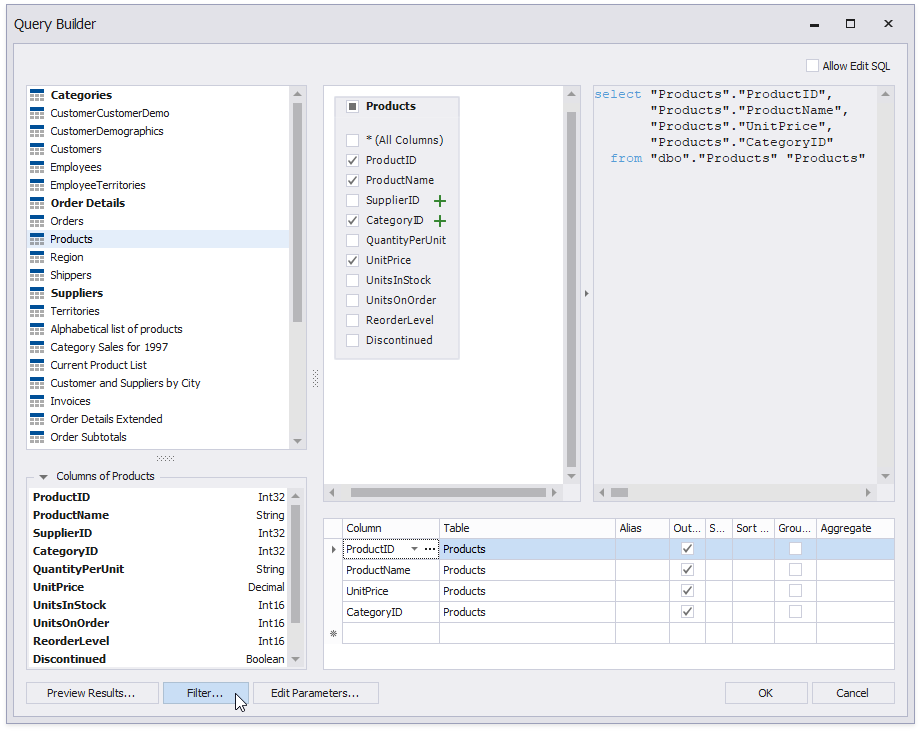
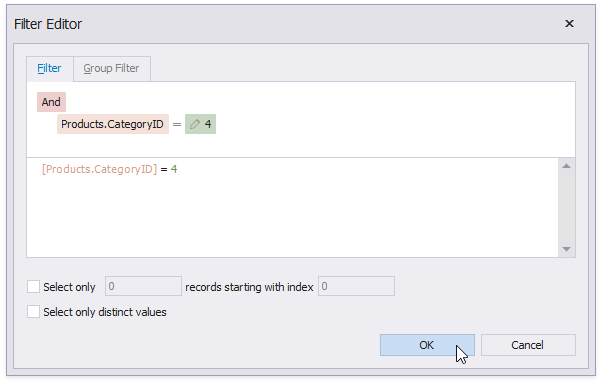
Specify the following filter criteria: CategoryID = 4. Click OK.
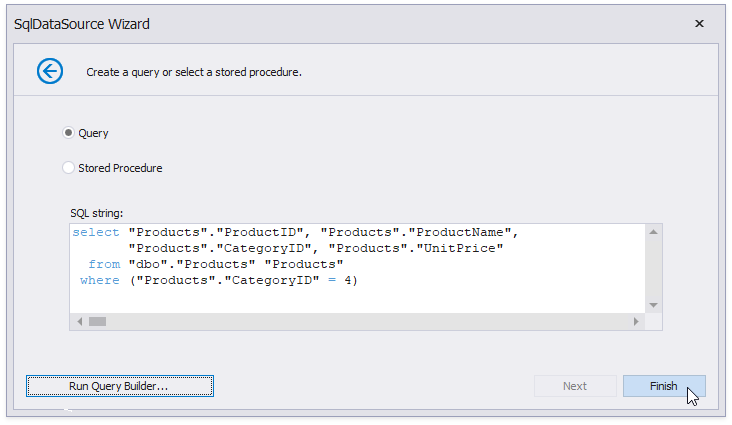
The newly created SQL query is displayed on the next form. Click Finish.
The Data Source Wizard also creates the SqlDataSource and BindingSource objects.
Step 3. Add a Series and Specify Its Data
Click the chart’s smart tag and select Series….
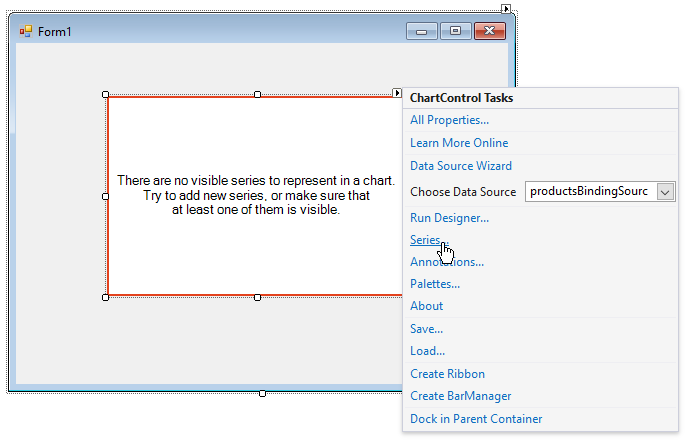
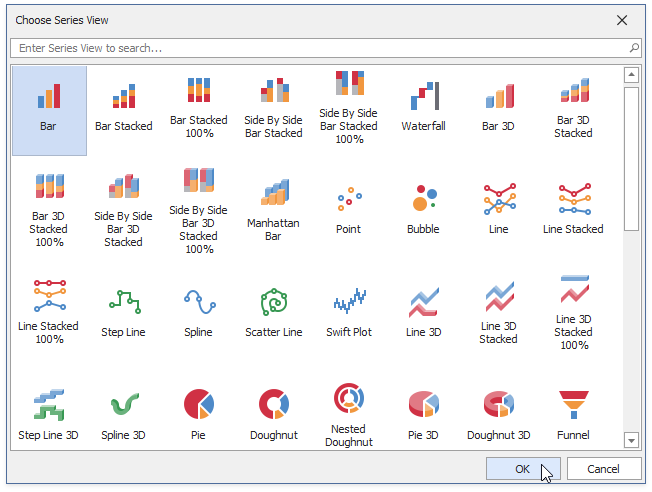
Click Add… in the Series Collection Editor. Select the Bar view and click OK.
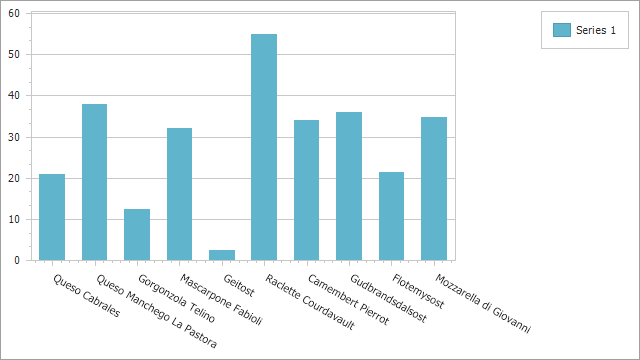
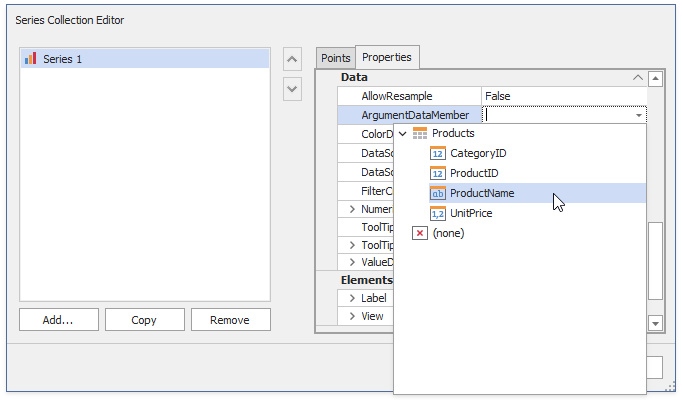
Switch to the Properties tab and set ArgumentDataMember to ProductName.
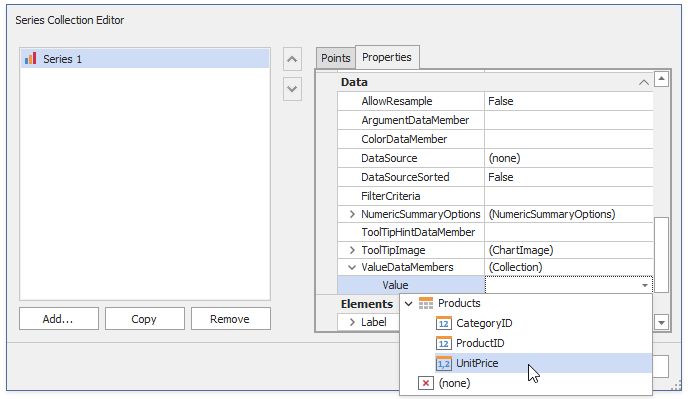
Set the Value of the ValueDataMembers property to UnitPrice.
The image below shows the result: