Axes
- 4 minutes to read
This document details the use of axes in XtraCharts: their purpose, implementation and capabilities. It highlights the basics on axis scale types, scrolling and visible range, using primary and secondary axes and axes’ elements. Before reading this text, it may be useful to review Basic Terms: Axes and Panes. To learn more on the hierarchy of elements in the WinForms Chart, refer to Chart Element Hierarchy.
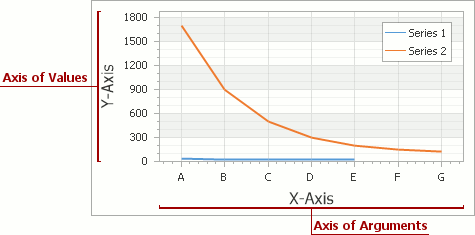
For charting, the rectangular coordinate system is used to determine each point uniquely on a plane through two numbers, the argument and the value of the point. To define the coordinates, two perpendicular directed lines - the axes are specified: the axis of arguments (X-axis) and the axis of values (Y-axis).
It’s possible to rearrange the axes positions: to display the X-axis vertically, and the Y-axis horizontally, via the XYDiagram.Rotated property. Note that this doesn’t affect the functionality of axes, and their flipped position doesn’t alter their functionality; the axis of arguments is still the X-axis, and the axis of values - the Y-axis.
Structurally, axes belong to a chart’s diagram object, and the diagram types which support axes are: XY-Diagram, Gantt Diagram, XY-Diagram 3D and Radar Diagram. So, since there are multiple diagram types, each supporting specific series view types, there is some specificity in implementing axes for different diagram types. For the purpose of simplicity, and since the XY-Diagram is the most common type, it’s used in this document, to demonstrate axes’ functionality.
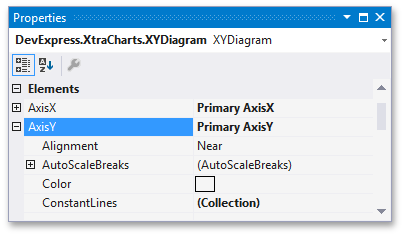
To access axes at design time, select your chart control, and in the Properties window, expand the ChartControl.Diagram property. You’ll see the XYDiagram.AxisX and XYDiagram.AxisY properties, which provide access to the appropriate axes’ options and elements.
At runtime, to access axes, you need to cast your Diagram object’s instance to the required type, as the following code demonstrates.
XYDiagram diagram = chart.Diagram as XYDiagram;
if (diagram != null) {
    diagram.AxisY.Title.Text = "Population mid-year, millions";
}
In XtraCharts, there is a stiff inter-dependence between the scale type of series and axes. Since series points should have their arguments and values defined, and these arguments (and their values) should fall under one of the three scale types available: (Numerical, DateTime, TimeSpan or Qualitative). Note that you do not need to change the argument scale type of the SeriesBase.ArgumentScaleType property (set to the Auto mode, by default) because the type of series point argument is detected automatically based on the type of underlying data. To learn more, refer to Axis Scale Types.
Another notable feature is the capability to limit the whole range of an axis, along with its visible range. To learn more on this, refer to Visual Ranges and Whole Ranges .
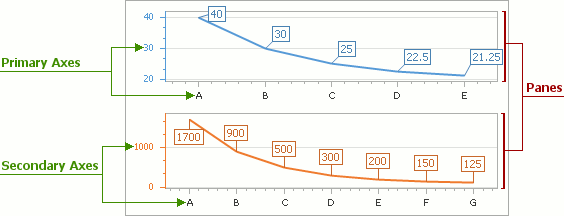
Besides the primary axes, it’s possible to add an indefinite number of secondary axes to a diagram’s collection. You can assign them to the required series instead of the primary axes, and distribute them among separate panes. To learn more on this, refer to Primary and Secondary Axes.
It’s possible to independently customize the appearance of each axis in a great many ways. For more information on this, refer to the following documents: Grid Lines, Tickmarks and Interlacing and Axis Appearance and Position.
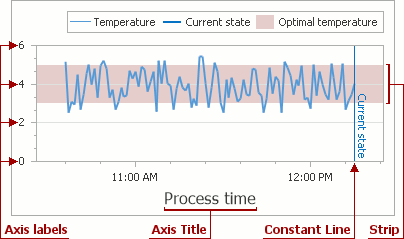
In addition, the XYDiagram.AxisX and XYDiagram.AxisY properties provide access to axes’ child elements: axis title, axis labels, strips and constant lines. For a detailed description of each element, refer to the corresponding document. These elements are shown in the following image.
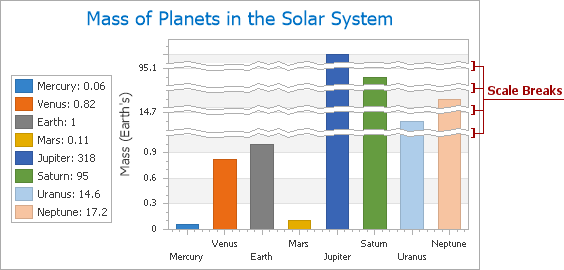
Moreover, on any axis, scale breaks can be inserted, to replace a fragment of the axis’ range with a ragged area.
Note
The Chart Control can hide its elements if there is insufficient space to display them. Elements are hidden in the following order:
To make the Chart Control always display its elements, disable the ChartControl.AutoLayout property.